ContentIQ working paperCIQ-WP-2026-01Weekly reportVersion 11 Oct 2026
Price-led hooks and unboxings sell more per view on TikTok Shop, while the dominant demo format trails the market
Our analysis of 13,309 top-selling TikTok Shop videos across 29 categories, 3,340 analysed in depth, 25 September to 1 October 2026
MediaLabs Research · in collaboration with Coherence Limited
Key findings
- 011.53×Sales per view for price or deal hooks (range 1.37–1.71)
- 021.37×Sales per view for unboxing videos (range 1.20–1.57)
- 0334%Share of sales from demo or tutorial videos, which sell at 0.92× per view
- 040.67×Sales per view for photo slideshows (range 0.60–0.75)
- 050.76×Sales per view for hooks built on borrowed TV, film or viral clips
- 060.64Model AUC for ranking sellers (range 0.57–0.70)
Contents
Abstract
We examine which creative choices in top-selling TikTok Shop videos are associated with higher sales per view during week 40 of 2026, using a shrunken yield index where 1 equals the market average. Price or deal hooks sold at 1.53× the market (90% range 1.37–1.71) and unboxing formats at 1.37× (1.20–1.57), while demo or tutorial videos, which carried 34% of watched-video sales, sold at 0.92× (0.88–0.96) and photo slideshows at 0.67× (0.60–0.75). A predictive model ranks videos only modestly better than chance (AUC 0.64, range 0.57–0.70) and was not restricted to analyses blind to sales. Because no prior baseline was available for this window, week-on-week rises and fades cannot yet be measured, and these results describe one 7-day snapshot.
1. Introduction
Brands and creators on TikTok Shop make many small creative decisions: how to open a video, which format to use, whether to film live action or rely on AI. This report asks which of those choices are associated with more sales per view among top-selling videos in the last 7 days, and how far they can be used to anticipate which videos sell.
Prior work shows that attention on online platforms is long-tailed and that early popularity is a strong predictor of later popularity [1]. Recent short-video popularity research builds multimodal predictors [2], and the strongest current systems find that creator features carry most of the predictive signal [3]. Creative attributes alone should therefore be expected to explain only part of commercial performance.
We focus on sales per view rather than raw sales, so that a creative choice is not credited simply for appearing in videos that reached large audiences.
2. Data and methods
The sample covers 13,309 top-selling TikTok Shop videos across 29 categories published or selling between 25 September and 1 October 2026. Of these, 3,340 were analysed in depth and coded for hook type, hook source, format, production style and use of AI. Shares of sales reported here are shares of sales among these analysed videos.
For each creative attribute we compute a sales-per-view index relative to the market average (1 = average). Small groups are shrunk toward the market mean with empirical-Bayes estimation [4], and we report 90% intervals; each estimate carries a confidence grade reflecting the number of videos behind it. Groups with fewer than about 30 videos are graded medium or low and should be read as indicative.
We also fitted a predictive model on 2,667 training rows, tested on a time split so that later videos are scored by a model trained on earlier ones. Ranking performance is measured by AUC [5], with a bootstrap 90% range [6]. The model reached an AUC of 0.641 (range 0.573–0.696). It was not restricted to analyses that never saw sales (cleanOnly is false), so some leakage from sales information into the coded features cannot be ruled out.
Daily rankings of top-selling TikTok Shop videos, products and categories in the US were collected from several independent sources and merged into one record per video. Where sources overlap, their sales estimates are cross-checked against each other, and videos whose estimates disagree by more than half are flagged. An AI analyst watched each video and recorded its opening, format, angle, production style, use of AI and hook source, without seeing how the video sold. Sales per view is a video group's revenue per view divided by the market's, shrunk toward the average for small groups, with 90% ranges. This paper covers 2026-09-25 to 2026-10-01: 13,309 videos tracked, 3,340 watched and analysed in total. Predictions come from a logistic model retrained daily and tested on recent weeks it had not seen.
3. Results: hooks
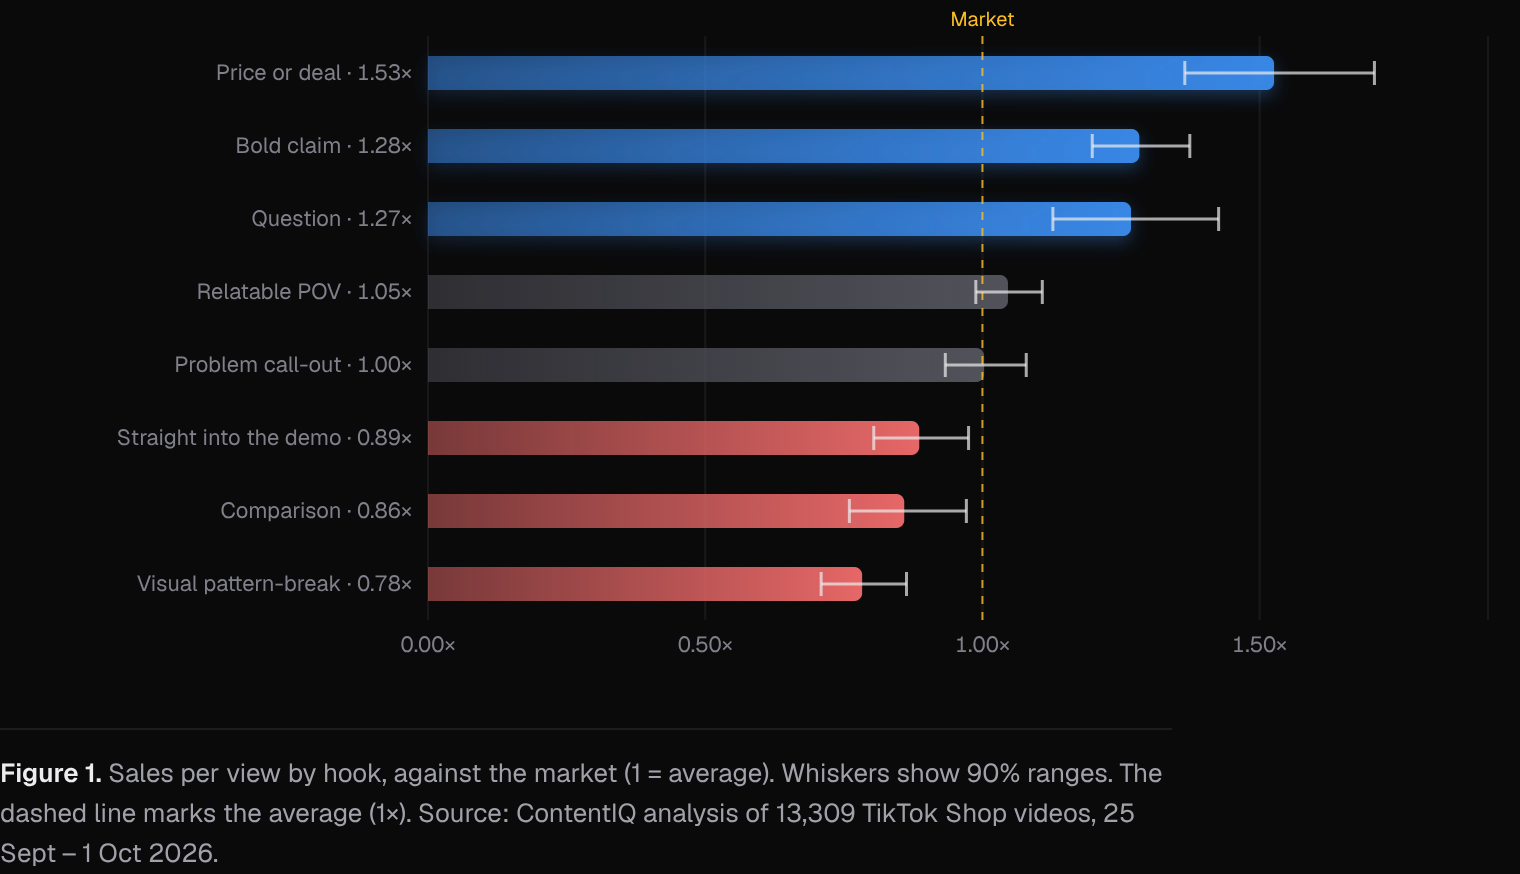
Three opening styles sold clearly above the market per view. Price or deal hooks sold at 1.53× (1.37–1.71, 193 videos), bold claims at 1.28× (1.20–1.37, 478 videos) and questions at 1.27× (1.13–1.43, 184 videos). Bold claims are also the second-largest hook by share of sales at 16%.
The most common hook, relatable POV, carried 20% of sales but sold close to average at 1.05× (0.99–1.11). Problem call-outs, at 14% of sales, sat at 1.00× (0.93–1.08). Hooks that go straight into the demo sold below the market at 0.89× (0.80–0.98), and unboxing-reveal openings at 0.88× (0.76–1.02), an interval that just reaches the average.
By hook source, openings built on a product close-up sold at 1.15× (1.00–1.32), while borrowed clips from TV, film, news or viral content sold at 0.76× (0.60–0.97, 41 videos). AI-generated clip openings showed 1.37×, but on only 20 videos with a range of 1.00–1.87, so this is not a reliable signal yet.
4. Results: formats and production style
Format shows a clear split between volume and efficiency. Demo or tutorial videos are the dominant format, with 1,183 videos and 34% of sales, yet sold at 0.92× per view (0.88–0.96). Unboxing videos sold at 1.37× (1.20–1.57), voice-over B-roll at 1.29× (1.18–1.41), reviews or testimonials at 1.27× (1.17–1.37) and talking heads at 1.18× (1.09–1.28). Skits sold below the market at 0.86× (0.77–0.97).
Filmed live action accounts for 93% of sales and sold marginally above average at 1.04× (1.00–1.07). Photo slideshows, with 6% of sales, sold at 0.67× (0.60–0.75), the clearest underperformer in the data. Mixed media sold at 0.68× (0.48–0.98) on 24 videos.
AI use remains rare. Videos with no visible AI carried 78% of sales at 1.02× (0.98–1.06), and AI voice-overs carried 20% at 0.95× (0.89–1.03). Fully AI-generated videos (22 videos, 1.32×, range 0.98–1.78) and AI-generated footage (17 videos, 1.40×, range 0.99–1.99) show high point estimates, but their intervals include the market average and the counts are too small to draw conclusions.
| Value | Videos (n) | Share of sales | Sales per view | 90% range |
|---|---|---|---|---|
| Unboxing | 135 | 3.5% | 1.37× | 1.20–1.57 |
| Voice-over B-roll | 333 | 11.1% | 1.29× | 1.18–1.41 |
| Review or testimonial | 352 | 11.6% | 1.27× | 1.17–1.36 |
| Talking head | 406 | 13.1% | 1.18× | 1.09–1.27 |
| Green screen | 20 | 1% | 1.16× | 0.76–1.78 |
| Routine / GRWM | 106 | 3.4% | 1.09× | 0.95–1.26 |
| Before and after | 28 | 2% | 0.98× | 0.79–1.21 |
| Day in the life | 8 | 0.1% | 0.94× | 0.57–1.56 |
| Demo or tutorial | 1,183 | 33.8% | 0.92× | 0.88–0.96 |
| Comparison | 111 | 4% | 0.90× | 0.78–1.04 |
Note. Sales per view is relative to the market (1.00 = average), shrunk toward the average for small groups (empirical Bayes); ranges are 90% intervals on the log scale.
5. Discussion and conclusion
For creators and brands, the pattern this week is that openings which state a price, a deal or a strong claim, and formats that centre a person or a product reveal, are associated with higher sales per view, while the most widely used demo format and photo slideshows sell below the market. The largest shares of sales sit in formats that are only average or below average per view, which suggests room to test higher-yield openings and formats within existing product demos.
The model drivers point in a similar direction: filmed live action (odds ratio 2.54), no visible AI (1.71) and before-and-after content (1.66) were associated with higher odds of being a strong seller, as was ad boosting (1.59), while education content (0.59) and showing the product in the first second (0.62) were associated with lower odds. With an AUC of 0.64 (0.57–0.70), creative attributes rank videos only modestly better than chance, consistent with prior findings that creator-level factors drive most of the predictive signal [3] and that attention is highly concentrated [1].
Alternative explanations matter. Price-led hooks may cluster in categories or price points that convert well regardless of creative, ad boosting may raise both reach and conversions, and the sample consists of top-selling videos, so these are associations within successful content rather than effects of any choice. These results describe a single 7-day window; because no earlier baseline was available, we cannot yet say which styles rose or faded, and the next edition will report week-on-week movement.
Methodology
Daily rankings of top-selling TikTok Shop videos, products and categories in the US were collected from several independent sources and merged into one record per video. Where sources overlap, their sales estimates are cross-checked against each other, and videos whose estimates disagree by more than half are flagged. An AI analyst watched each video and recorded its opening, format, angle, production style, use of AI and hook source, without seeing how the video sold. Sales per view is a video group's revenue per view divided by the market's, shrunk toward the average for small groups, with 90% ranges. This paper covers 2026-09-25 to 2026-10-01: 13,309 videos tracked, 3,340 watched and analysed in total. Predictions come from a logistic model retrained daily and tested on recent weeks it had not seen.
Limitations
Most videos in the sample are top-ranked, so findings mostly separate strong sellers from good ones rather than from all videos; typical and weak videos are being added. Results are associations, not causes. Paid promotion, creator audience size and product price are not fully controlled for. Revenue and views are estimates, not figures reported by TikTok. This is a single 7-day window, and no prior baseline was available, so all week-on-week movements are recorded as new and no rise or fade can be measured. The predictive model was not restricted to analyses that never saw sales (cleanOnly is false), so its AUC may be optimistic. Several groups, including AI-generated footage, fully AI-generated videos, AI avatar presenters, day-in-the-life and green screen formats, rest on fewer than 30 videos and have wide intervals. The sample includes only top-selling videos, results are not broken down by category, and shares refer to sales among the 3,340 videos analysed in depth.
References
- [1]Szabo, G., & Huberman, B. A. (2010). Predicting the popularity of online content. Communications of the ACM, 53(8), 80–88. cacm.acm.org/research/predicting-the-popularity-of-online-content
- [2]Lu, J., Wang, W., Xiao, M., et al. (2024). M3TR: Temporal retrieval enhanced multi-modal micro-video popularity prediction. arXiv:2411.15455. arxiv.org/abs/2411.15455
- [3]Ye, L., Zhang, Y., Wu, Y., et al. (2025). MVP: Winning solution to SMP Challenge 2025 video track. arXiv:2507.00950. arxiv.org/abs/2507.00950
- [4]Efron, B., & Morris, C. (1975). Data analysis using Stein’s estimator and its generalizations. Journal of the American Statistical Association, 70(350), 311–319.
- [5]Fawcett, T. (2006). An introduction to ROC analysis. Pattern Recognition Letters, 27(8), 861–874.
- [6]Efron, B., & Tibshirani, R. J. (1993). An Introduction to the Bootstrap. Chapman & Hall.
Cite as
MediaLabs Research, in collaboration with Coherence Limited (2026). Price-led hooks and unboxings sell more per view on TikTok Shop, while the dominant demo format trails the market. ContentIQ Working Paper CIQ-WP-2026-01, version 1. https://medialabs-co.com/research/weekly-2026-w40
Analysis and data: Coherence Research, Coherence ContentIQ. Published by MediaLabs in collaboration with Coherence Limited.
Version history
- Version 11 Oct 2026This version