ContentIQ working paperCIQ-WP-2026-37CategoryVersion 11 Oct 2026
In Home Improvement on TikTok Shop, products over $100 earn nearly half of top-product revenue while the category cools
875 videos tracked, 96 analysed in depth, 100 top-selling products, 2 Sept–1 Oct 2026
MediaLabs Research · in collaboration with Coherence Limited
Key findings
- 01−19%Category revenue, latest 4 weeks against the previous 4 (market over 13 weeks: −11%)
- 0247%Share of top-product revenue from products priced $100 and over (33 of 100 products)
- 0329%Share of category revenue through the shop tab, against 18% for the market
- 0467%Share of category revenue credited to affiliate creators
- 057%Revenue-weighted median affiliate commission rate
- 060.64AUC of the top-seller model (90% range 0.57–0.70)
Contents
Abstract
We analyse Home Improvement on TikTok Shop over the 30 days to 1 October 2026: its momentum, sales channels, prices, commission, competition and the video styles that sell. Category revenue in the latest 4 weeks was 19% below the previous 4, a steeper fall than the market's over 13 weeks (18% against 11%). Products priced at $100 and over earned 47% of top-product revenue, and 67% of category revenue was credited to affiliate creators. No hook or format shows a clearly better sales-per-view result at high confidence, and a model of top-selling videos has modest predictive power (AUC 0.64, 90% range 0.57–0.70).
1. Introduction
Brands and creators choosing what to sell and what to film in Home Improvement face a question that headline category rankings do not answer. Is the category growing or fading, where do its sales happen, which price points and commission rates carry the revenue, and do particular video styles sell better per view? This paper describes the category as it stood in September 2026.
Prior work on short-video popularity finds that attention is long-tailed and that early popularity predicts later popularity [1]. Recent benchmark solutions find that creator features matter most [2], and so content style alone is expected to explain only part of what sells. Live-stream selling has been linked to trust and engagement in social commerce [3], and affiliate commissions are set with a trade-off between reach and margin in mind [4]. Online retail also sells a long tail of niche products beyond the bestsellers [5].
All findings are observational. We describe what is associated with sales, not what causes them.
2. Data
Our analysis of TikTok Shop covers 2 September to 1 October 2026. In that window we tracked 875 Home Improvement videos. Our AI analyst watched and analysed 96 of them in depth. That is a count of videos, not of views. The marketplace figures rest on 100 top-selling products in the category. For the market comparison, 3,342 videos were watched across all categories.
For each analysed video we recorded the hook, format and production style, alongside its sales and views. For the category we recorded estimated weekly revenue over the past year, the split of revenue by sales channel, product prices, affiliate commission rates, product launch dates, and counts of shops and active products. Channel, price, commission and competition figures are as of the latest week (29 September to 1 October 2026).
The video sample is small for most groups. Sales-per-view results are therefore marked with a confidence level, and most hook and format groups have low confidence.
Daily rankings of top-selling TikTok Shop videos in the US were collected from several independent sources and merged into one record per video. Where sources overlap, their sales estimates are cross-checked against each other, and videos whose estimates disagree by more than half are flagged. An AI analyst watched each video and recorded its opening, format, angle, production style, use of AI, hook source, length, pacing and what appears in the first second, without seeing how the video sold. Sales per view is a video group’s revenue per view divided by the market’s, shrunk toward the average for small groups, with 90% ranges. Weekly category figures for the US (estimated revenue, its split between video, LIVE and the shop tab, affiliate revenue, shops and active products, and a year of weekly revenue) and daily rankings of each category’s top-selling products (unit price, commission rate, launch date and revenue by channel) were collected from several independent sources. Medians of price and commission are weighted by revenue; momentum compares the latest weeks with the same number of weeks before. This paper covers 2026-09-02 to 2026-10-01: 875 videos tracked in Home Improvement, 96 of them watched and analysed; the market baseline uses all 3,342 watched videos; 100 top-selling products in Home Improvement. Predictions come from a logistic model retrained daily and tested on recent weeks it had not seen.
3. Methods
Sales per view is a group of videos' revenue per view divided by the market's, so 1 is the market average. Small groups are shrunk toward the average by empirical Bayes [6], and we report 90% intervals computed on the log scale. A range that spans 1 means the group cannot be distinguished from the average.
The predictive model is a logistic model of top-selling videos, retrained daily and tested on recent weeks it had not seen (a time-split). We report AUC [7] with a bootstrap range [8]. It was trained on 2,667 rows, and it was not restricted to analyses that never saw sales (cleanOnly is false), so its signals should be read with care.
Momentum compares estimated revenue in the latest 4 and 13 weeks with the same number of weeks before. Channel shares split the latest week's revenue into shoppable video, LIVE and the shop tab. Prices, commission and product age are measured on the top-selling products and weighted by revenue. Concentration is the top ten's share of top-product revenue and the Herfindahl–Hirschman index [9]. Seasonality is each month's revenue against the category's average month over the past year, excluding partial months, in the spirit of seasonal-trend separation [10].
4. Results: Momentum, channels and competition
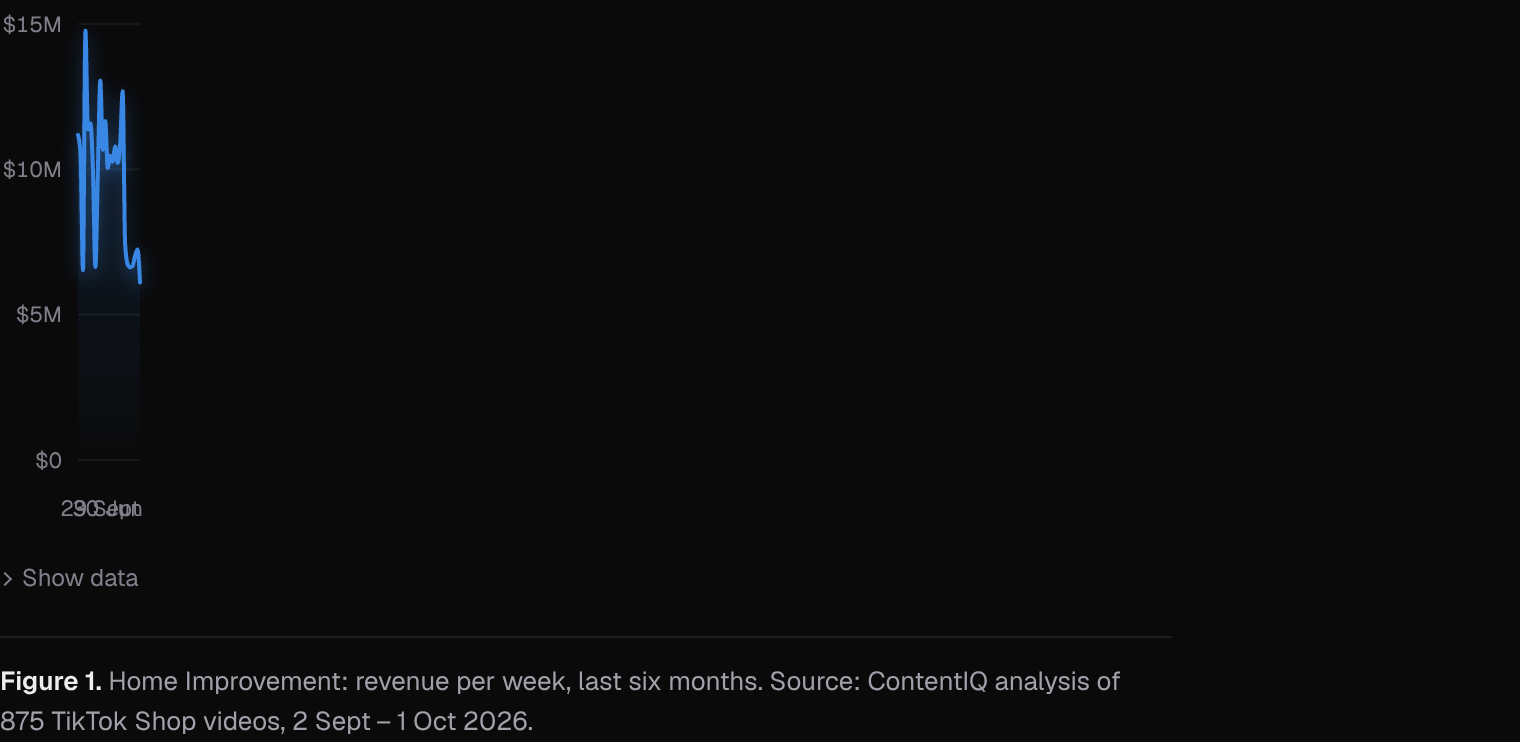
Home Improvement accounted for 1.8% of market revenue in the latest 4 weeks and ranked 20th of 28 categories. Its revenue in the latest 4 weeks was 19.3% below the previous 4 weeks. Over 13 weeks it was 18% below the previous 13, while the market as a whole was 11.1% below. The category is therefore falling faster than the market, although the monthly seasonal pattern (below) means part of this may be calendar effects.
Sales skew away from shoppable video. In the latest week, video carried 49.7% of category revenue (market 64.9%), LIVE 21% (market 17.1%) and the shop tab 29.3% (market 18%). Affiliate creators were credited with 67.4% of category revenue.
The category has 5,591 shops and 22,401 active products. Average revenue per shop was $1,871, against $2,401 in the median category, which has 4,461 shops. Concentration among top products matches the median category: the top ten products hold 33.2% of top-product revenue, with a Herfindahl–Hirschman index of 176. Revenue is spread widely rather than held by a few products.
5. Results: Prices, commission and product age
The revenue-weighted median price of top-selling products was $85, but prices are widely spread: the middle half runs from $27 to $449. Products at $100 and over (33 products) earned 47.4% of top-product revenue, and revenue per product there was 1.44× the average product. Products under $10 (3 products) earned 1.4% of revenue at 0.48× the average, and the $10–20 band (24 products) earned 17.9% at 0.75×.
The revenue-weighted median commission rate was 7%. Most revenue (69.7%) came from 60 products paying 5–10%. Reliance on video differs by commission band: 84.6% of revenue for products paying 10–15% (15 products) came through video, against 36.7% in the 5–10% band. The 20–30% band holds a single product, so we draw no conclusion from it.
Established products dominate. Products launched in the last 90 days earned 4.2% of top-product revenue, and those aged 6 months to 2 years earned 75.4% (34.2% plus 41.2%). Launches under 30 days (2 products) and 30–90 days (5 products) are too few to describe reliably, though their revenue per product was 0.53× and 0.62× the average.
| Band | Products (n) | Share of revenue | Revenue per product vs average |
|---|---|---|---|
| Under $10 | 3 | 1.4% | 0.48× |
| $10–20 | 24 | 17.9% | 0.75× |
| $20–35 | 18 | 12.3% | 0.68× |
| $35–60 | 14 | 13% | 0.93× |
| $60–100 | 8 | 8% | 1.00× |
| $100 and over | 33 | 47.4% | 1.44× |
Note. Among the top-selling products we track in the latest week; revenue per product is against the average product in the same set (1.00 = average).
6. Results: Formats, hooks and production
Demo or tutorial is the most common format (53 videos, 62.8% of watched-video sales) and is the only format with high confidence. Its sales per view was 0.92× the market (90% range 0.76–1.11), consistent with average. Talking head had the highest estimate at 1.67× (1.07–2.61), but it rests on 7 videos at low confidence. Slideshow was lowest at 0.75× (0.54–1.06), on 5 videos.
Hooks are tightly clustered. Problem call-out (19 videos, 27% of sales) was 1.05× (0.82–1.34), bold claim 1.03× (0.64–1.67) and straight into the demo 1.02× (0.72–1.43). Every hook range spans 1, so we cannot separate any hook from the market average. All analysed production was filmed live action (49 videos), at 1.05× (0.84–1.31), so there is no contrast in production style within the sample.
| Value | Videos (n) | Share of sales | Sales per view | 90% range |
|---|---|---|---|---|
| Talking head | 7 | 7.7% | 1.67× | 1.06–2.61 |
| Skit | 7 | 11% | 1.08× | 0.78–1.51 |
| Voice-over B-roll | 9 | 9.6% | 1.00× | 0.74–1.35 |
| Demo or tutorial | 53 | 62.8% | 0.92× | 0.76–1.11 |
| Review or testimonial | 5 | 4.7% | 0.87× | 0.48–1.59 |
| Slideshow | 5 | 4.2% | 0.75× | 0.54–1.06 |
Note. Sales per view is relative to the market (1.00 = average), shrunk toward the average for small groups (empirical Bayes); ranges are 90% intervals on the log scale.
7. Discussion
For brands, the evidence points to higher-priced products and the shop tab as the places where Home Improvement revenue concentrates, with 47% of top-product revenue above $100. This fits the nature of the category, where considered purchases are common. A weak market for low-priced items is also a plausible reading, but our data cannot show why. Revenue per product by price band is an association, not an effect of price. The category is established rather than novel: few new launches reach the top-seller list.
For creators, the video-style results are mostly inconclusive. Demo videos are the bulk of sales and sit near average, and talking head is a promising but thinly supported signal. The model supports a modest reading: AUC 0.64 (0.57–0.70) means style features rank top sellers only somewhat better than chance, consistent with prior findings that creator features matter most [2]. Its strongest drivers were filmed live action (odds ratio 2.54), before and after (1.66) and boosted with ads (1.59), while education had an odds ratio of 0.59. Since the model was not restricted to analyses that never saw sales, we treat these as hypotheses.
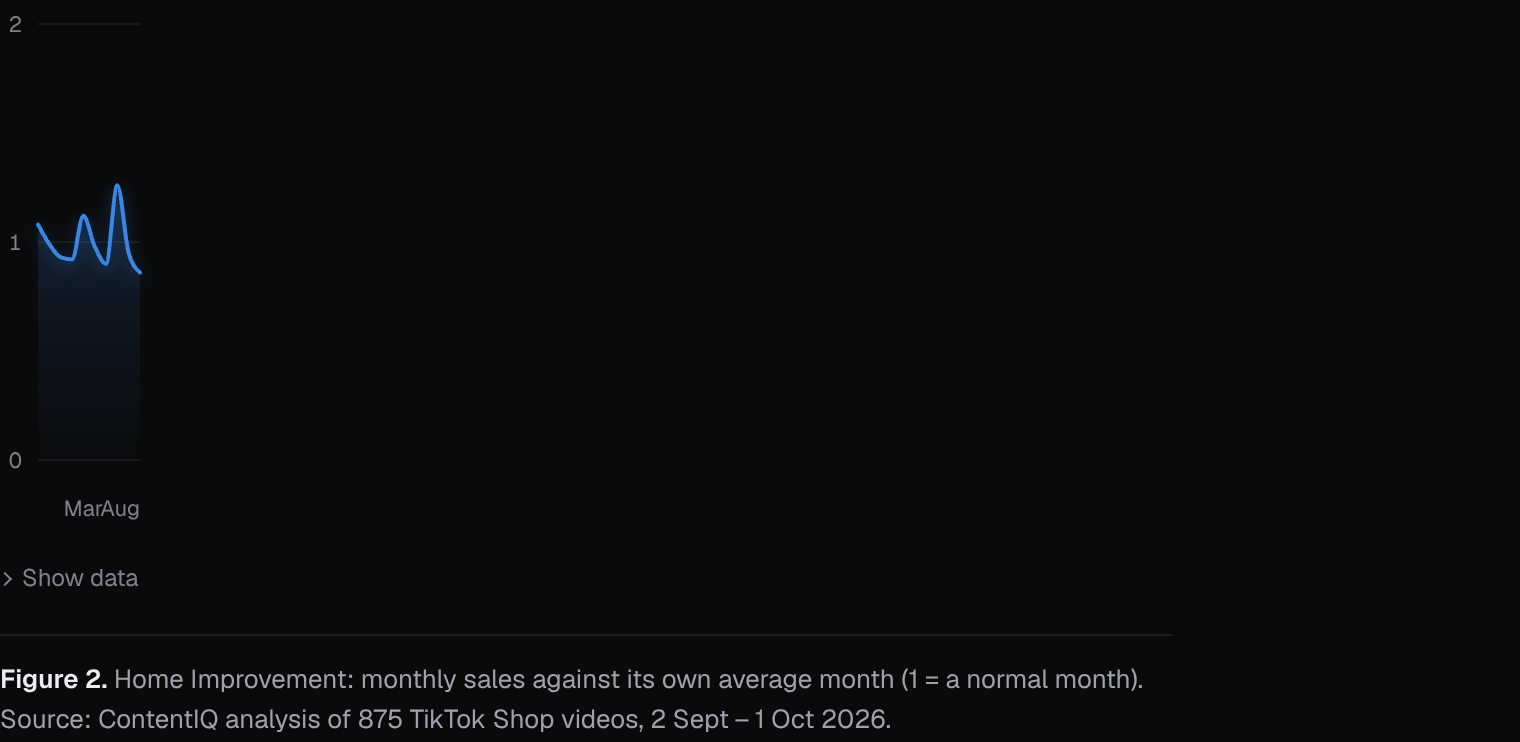
Alternative explanations abound. The sales decline may reflect seasonality, since our monthly index shows June at 1.26× a normal month and August at 0.86×. Ads and creator reach are hard to separate from content [11]. High commission bands relying more on video may reflect which products offer those rates, not the commission itself.
8. Conclusion
Home Improvement on TikTok Shop is a mid-sized category (rank 20 of 28) that is shrinking faster than the market, sells more through the shop tab and LIVE than the market does, and earns nearly half its top-product revenue from items priced at $100 and over. Competition is broad, with 5,591 shops and a top-ten concentration equal to the median category.
Looking ahead, Halloween is under way, Black Friday / Cyber Monday starts in 40 days, holiday gifting in 45 days and New Year resolutions in 92 days. Monthly revenue was 1.08× a normal month in November 2025 and 0.99× in December 2025, so these moments have not historically lifted the category much. Brands and creators should treat the video-style findings as provisional until larger samples are available.
Methodology
Daily rankings of top-selling TikTok Shop videos in the US were collected from several independent sources and merged into one record per video. Where sources overlap, their sales estimates are cross-checked against each other, and videos whose estimates disagree by more than half are flagged. An AI analyst watched each video and recorded its opening, format, angle, production style, use of AI, hook source, length, pacing and what appears in the first second, without seeing how the video sold. Sales per view is a video group’s revenue per view divided by the market’s, shrunk toward the average for small groups, with 90% ranges. Weekly category figures for the US (estimated revenue, its split between video, LIVE and the shop tab, affiliate revenue, shops and active products, and a year of weekly revenue) and daily rankings of each category’s top-selling products (unit price, commission rate, launch date and revenue by channel) were collected from several independent sources. Medians of price and commission are weighted by revenue; momentum compares the latest weeks with the same number of weeks before. This paper covers 2026-09-02 to 2026-10-01: 875 videos tracked in Home Improvement, 96 of them watched and analysed; the market baseline uses all 3,342 watched videos; 100 top-selling products in Home Improvement. Predictions come from a logistic model retrained daily and tested on recent weeks it had not seen.
Limitations
Most videos in the sample are top-ranked, so findings mostly separate strong sellers from good ones rather than from all videos; typical and weak videos are being added. Product figures cover the top-selling products we track in each category, not every listing, so they describe what sells best rather than everything on sale. Results are associations, not causes. Paid promotion, creator audience size and product price are not fully controlled for. Revenue, views and sales are estimates, not figures reported by TikTok. The window is 30 days and covers one category, so results may reflect short-term events. Only 96 of 875 tracked videos were analysed in depth, and most hook and format groups have 5–19 videos and low confidence. The seasonal index rests on a single year, so each month is seen once. Price, commission and age figures cover only the 100 top-selling products and may not describe the wider catalogue of 22,401 active products. The model was not restricted to analyses that never saw sales, and it has modest accuracy.
References
- [1]Szabo, G., & Huberman, B. A. (2010). Predicting the popularity of online content. Communications of the ACM, 53(8), 80–88. cacm.acm.org/research/predicting-the-popularity-of-online-content
- [2]Ye, L., Zhang, Y., Wu, Y., et al. (2025). MVP: Winning solution to SMP Challenge 2025 video track. arXiv:2507.00950. arxiv.org/abs/2507.00950
- [3]Wongkitrungrueng, A., & Assarut, N. (2020). The role of live streaming in building consumer trust and engagement with social commerce sellers. Journal of Business Research, 117, 543–556.
- [4]Libai, B., Biyalogorsky, E., & Gerstner, E. (2003). Setting referral fees in affiliate marketing. Journal of Service Research, 5(4), 303–315.
- [5]Brynjolfsson, E., Hu, Y. J., & Smith, M. D. (2003). Consumer surplus in the digital economy: Estimating the value of increased product variety at online booksellers. Management Science, 49(11), 1580–1596.
- [6]Efron, B., & Morris, C. (1975). Data analysis using Stein’s estimator and its generalizations. Journal of the American Statistical Association, 70(350), 311–319.
- [7]Fawcett, T. (2006). An introduction to ROC analysis. Pattern Recognition Letters, 27(8), 861–874.
- [8]Efron, B., & Tibshirani, R. J. (1993). An Introduction to the Bootstrap. Chapman & Hall.
- [9]Rhoades, S. A. (1993). The Herfindahl–Hirschman index. Federal Reserve Bulletin, 79, 188–189.
- [10]Cleveland, R. B., Cleveland, W. S., McRae, J. E., & Terpenning, I. (1990). STL: A seasonal-trend decomposition procedure based on loess. Journal of Official Statistics, 6(1), 3–73.
- [11]Lewis, R. A., & Rao, J. M. (2015). The unfavorable economics of measuring the returns to advertising. The Quarterly Journal of Economics, 130(4), 1941–1973.
Cite as
MediaLabs Research, in collaboration with Coherence Limited (2026). In Home Improvement on TikTok Shop, products over $100 earn nearly half of top-product revenue while the category cools. ContentIQ Working Paper CIQ-WP-2026-37, version 1. https://medialabs-co.com/research/category-home-improvement
Analysis and data: Coherence Research, Coherence ContentIQ. Published by MediaLabs in collaboration with Coherence Limited.
Version history
- Version 11 Oct 2026This version