ContentIQ working paperCIQ-WP-2026-69CreativeVersion 118 Oct 2026
When to refresh UGC: planning around video shelf life
51,843 videos tracked, 29 categories, 19 Sept–18 Oct 2026
MediaLabs Research · in collaboration with Coherence Limited
Key findings
- 0119.6%of top-video revenue came from videos more than 3 months old
- 029.2%of top-video revenue came from videos under a week old
- 031.6×revenue per 1,000 views, over-3-month-old videos ($21.92) vs under-a-week-old ($13.66)
- 0464.2–67.9%share of revenue that came with paid promotion, across all five age bands
- 05$3,912median weekly revenue of 2–4-week-old videos, the highest age band (vs $2,352 under a week)
- 0642.6%of top-video revenue came from the top 10% of video snapshots
Contents
Abstract
We examine how old the top-selling TikTok Shop videos in the US were when they sold, to help brands plan UGC review checkpoints. Videos older than three months took 19.6% of top-video revenue, and revenue per 1,000 views rose from $13.66 for videos under a week old to $21.92 for those over three months old (1.6×). Paid promotion accompanied 64.2% to 67.9% of revenue in every age band. An age mix across videos that are selling now is not a survival curve and does not measure creative fatigue, so we offer a checkpoint checklist and a holdout test plan as recommendations, not findings.
1. Introduction
Short answer: in these data, a video's age alone does not tell you when to replace it. Videos from every age band, including those over three months old, still accounted for a meaningful share of top-video revenue. We suggest scheduling review checkpoints at roughly one week, four weeks and three months, and deciding at each one from the video's own sales trend and, ideally, a small holdout test. That is a recommendation. It is not something this analysis measured.
The question matters because brands and creators pay to produce UGC and must decide whether to keep paying for reach on an existing video or commission new ones. Prior work finds that early popularity predicts later popularity and that online attention is long-tailed [1], which suggests that a few videos carry most of the results. Prior work also shows that the returns to advertising are hard to measure from observational data [2], which is why we separate what the data show from what we propose to test.
This paper describes the age mix of top-selling US TikTok Shop videos. It does not measure creative fatigue, because it does not follow individual videos through time.
2. Data
The window runs from 19 September to 18 October 2026. Our analysis tracked 51,843 videos across 29 categories. The economics and age figures rest on 114,064 video snapshots (one observation of a video at a daily snapshot, with trailing-seven-day estimates) from 35,199 videos. This paper uses sales, view and age records only. It does not use content analysis.
The records cover US TikTok Shop observations and are not representative of all UGC elsewhere. Each video appears only in weeks when it ranked as a top seller, so the sample is selected on selling.
Weekly figures for the top-selling TikTok Shop videos in the US were collected from commercial data providers: each video’s estimated revenue, views and engagement in each week it ranked, the share of its revenue and views that came from paid promotion (reported per video and top-coded at 80%), its estimated return on ad spend and its publish date. One row is a video observed on a particular snapshot date, with estimates for the preceding seven days. This paper covers 2026-09-19 to 2026-10-18: 51,843 videos tracked; this paper does not use in-depth creative analysis.
Daily seven-day video snapshots can overlap and repeat the same video. Counts are observations, not independent weeks. Aggregate shares and medians are snapshot-weighted; summed revenue is not unique sales over the publication window.
3. Methods
Video economics: we took the distribution of weekly revenue per video snapshot, the share of revenue taken by the top 10% and 1% of video snapshots, revenue and engagement per 1,000 views (totals divided by total views), and each category's share of revenue through video from its reported seven-day estimates.
Shelf life: a video's age is the number of days from its publication to the snapshot date. Revenue shares, revenue per 1,000 views, median weekly revenue and paid shares are computed within five age bands: under a week, 1–2 weeks, 2–4 weeks, 1–3 months and over 3 months. The paid share is the share of revenue that came with paid promotion. No uncertainty ranges are available for the age-band figures, so we treat small differences between bands as indicative only.
4. Results: where top-video revenue sits by age
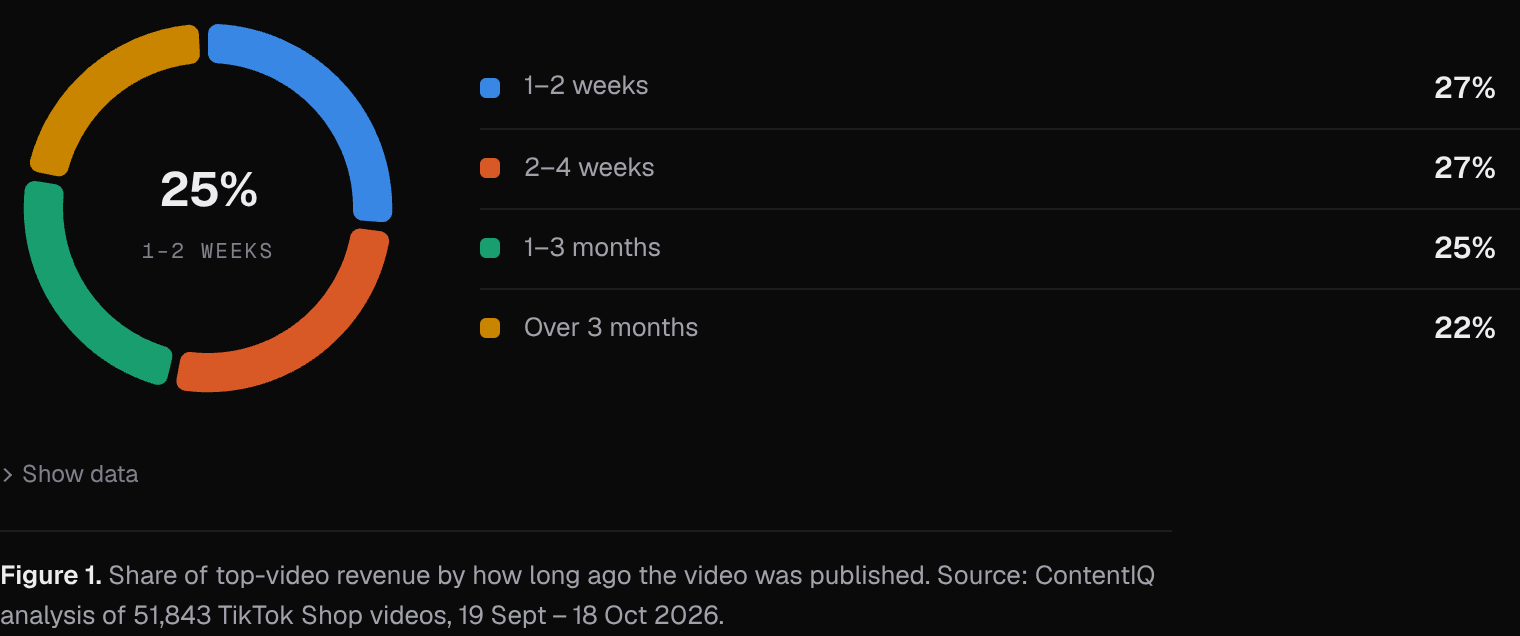
The age mix is spread across the bands rather than concentrated in new videos. Videos under a week old took 9.2% of top-video revenue, 1–2 weeks 24.7%, 2–4 weeks 24.2%, 1–3 months 22.3% and over 3 months 19.6%. Videos older than a month therefore accounted for about 41.9% of revenue (22.3% plus 19.6%).
The bands differ in width: the first holds 7 days and the last has no upper limit. Shares per band are not shares per day, and the first band is also partly truncated because a video published late in a week has less time to sell.
This is a snapshot of videos that are selling now. It cannot show how many videos of each age were published, how many dropped out of the rankings, or how any single video's sales changed with age.
5. Results: yield and paid share by age
Revenue per 1,000 views rises with age in this snapshot: $13.66 under a week, $13.82 for 1–2 weeks, $16.20 for 2–4 weeks, $17.30 for 1–3 months and $21.92 over 3 months. The oldest band is 1.6× the youngest. Median weekly revenue per video snapshot is highest at 2–4 weeks ($3,912), against $2,352 under a week, $3,432 at 1–2 weeks, $2,808 at 1–3 months and $2,596 over 3 months.
Paid promotion accompanied 65.5%, 66.2%, 67.9%, 67.4% and 64.2% of revenue in the five bands respectively. Reported paid shares are similar across bands, but this does not rule out differences in spend, targeting or paid-reach selection as explanations for the yield pattern.
One likely explanation is selection: older videos appear in a top-seller list only if they kept selling, so those we observe are survivors. Their higher revenue per 1,000 views may reflect that selection rather than any benefit of age.
| Published | video snapshots (n) | Share of revenue | Revenue per 1,000 views | Median weekly revenue | Paid share of revenue |
|---|---|---|---|---|---|
| Under a week | 12,464 | 9.2% | $13.66 | $2.4K | 65.5% |
| 1–2 weeks | 24,193 | 24.7% | $13.82 | $3.4K | 66.2% |
| 2–4 weeks | 23,153 | 24.2% | $16.20 | $3.9K | 67.9% |
| 1–3 months | 26,409 | 22.3% | $17.30 | $2.8K | 67.4% |
| Over 3 months | 24,877 | 19.6% | $21.92 | $2.6K | 64.2% |
Note. Age is days from publication to the end of the week the video sold in. Paid shares are top-coded at 80% per video, so they are lower bounds.
6. Results: a few video snapshots carry much of the revenue
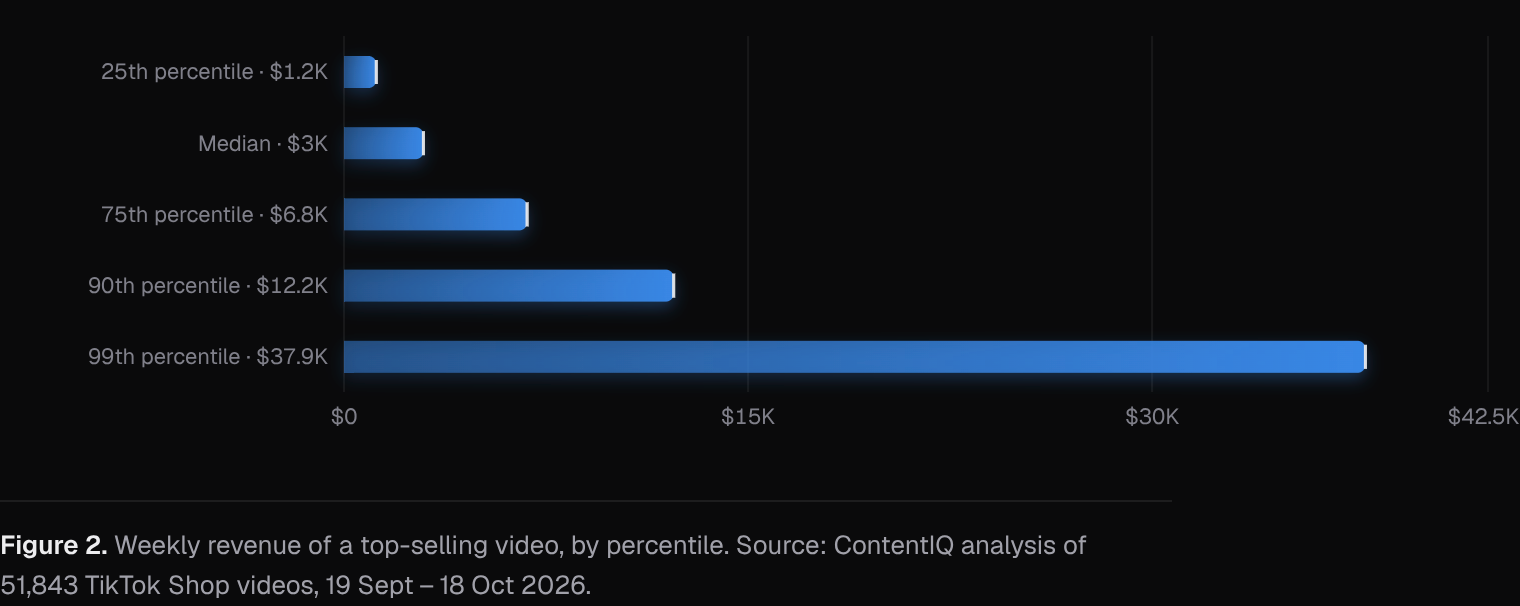
The median top-selling video earned $2,950 in a week. The 25th percentile was $1,199, the 75th $6,799, the 90th $12,240 and the 99th $37,920. The top 10% of video snapshots took 42.6% of video revenue and the top 1% took 11.1%.
The top-10% share ranges across categories from 27.2% in Menswear & Underwear to 45.4% in Household Appliances. Overall revenue per 1,000 views was $16.3, and category values ranged from $9.78 in Books, Magazines & Audio to $29.14 in Household Appliances. We report no category-level age results here because the category age medians are not part of this evidence.
Because revenue is concentrated in a minority of video snapshots, the average video is a poor guide to any single refresh decision.
7. Discussion
For brands and creators, these figures argue against retiring a video on age alone. Older videos were still a large part of top-video revenue, and the weakest median came in the first week, not the later bands. The pattern fits the idea that early popularity is informative about later popularity [1], though our data cannot test that.
The age mix is not a survival curve and not a measure of creative fatigue. Fatigue would mean a given video's sales fall as audiences see it more often. That needs repeated observations of the same video, including its decline and the videos that left the rankings. Alternative explanations for the patterns here include survivor selection, different band widths, product or season effects, changes in paid spend over a video's life, and different categories having different age mixes. Observational comparisons of this kind are weak guides to the returns to promotion [2].
Recommendation, not a finding: a checkpoint checklist and test plan. (1) Schedule reviews at about one week, four weeks and three months after publishing, matching the age bands above. (2) At each review, compare the video's weekly revenue per 1,000 views with its own earlier weeks, not with other videos. (3) Record paid spend alongside sales, because roughly two-thirds of revenue in every age band came with paid promotion. (4) For a product with several similar videos, refresh a randomly chosen half at a checkpoint and leave the rest unchanged. (5) Compare the two groups' revenue per 1,000 views over the following two to four weeks, using a threshold set in advance. (6) Keep paid spend equal across groups, and treat one test as indicative only.
8. What this means for brands and founders
- Do not retire a video on age alone: videos over three months old accounted for 19.6% of top-video revenue, so decide from each video's own trend.
- Account for incomplete exposure in early reviews: under-a-week videos had a $2,352 median seven-day revenue estimate versus $3,912 at 2–4 weeks. Unequal exposure and survivor selection prevent these figures from establishing an optimal review date.
- Plan for paid reach: in every age band at least 64.2% of top-video revenue came with paid promotion, so record spend next to sales at each checkpoint.
- Compare refreshes on revenue per 1,000 views, not totals: it ran from $13.66 for videos under a week old to $21.92 for those over three months old (1.6×), and survivor selection may explain some of that.
- Test before you replace: the top 10% of video snapshots took 42.6% of revenue, so run a holdout with half your videos refreshed and half unchanged.
9. Conclusion
In US TikTok Shop top-seller data, revenue came from videos of every age: 9.2% from videos under a week old and 19.6% from those over three months old. Yield per 1,000 views was higher in older bands, and paid promotion accompanied 64.2% to 67.9% of revenue in all of them.
These snapshots do not measure shelf life or creative fatigue. Whether a refresh helps a given video is a question for the holdout test described above, run on your own products and spend.
Methodology
Weekly figures for the top-selling TikTok Shop videos in the US were collected from commercial data providers: each video’s estimated revenue, views and engagement in each week it ranked, the share of its revenue and views that came from paid promotion (reported per video and top-coded at 80%), its estimated return on ad spend and its publish date. One row is a video observed on a particular snapshot date, with estimates for the preceding seven days. This paper covers 2026-09-19 to 2026-10-18: 51,843 videos tracked; this paper does not use in-depth creative analysis.
Daily seven-day video snapshots can overlap and repeat the same video. Counts are observations, not independent weeks. Aggregate shares and medians are snapshot-weighted; summed revenue is not unique sales over the publication window.
Limitations
Video figures cover top-selling videos only. Paid shares are reported per video and top-coded at 80%, so they are lower bounds; ad spend and margins are not observed, so a reported return on ad spend says nothing about profit. Results are associations, not causes. Paid promotion, creator audience size and product price are not fully controlled for. Revenue, views and sales are estimates, not figures reported by TikTok. These are US TikTok Shop observations over a 30-day window, not all UGC everywhere. Videos appear only in weeks when they ranked as top sellers, so the age mix reflects survivors and is cross-sectional: it is not a survival curve and does not measure creative fatigue. Age bands have unequal widths, no uncertainty ranges are available for the age-band figures, and category-level age medians are not reported in this evidence. Paid share is associated with revenue but does not show that paid promotion caused it. The checklist and test plan are recommendations, not measured results. Daily seven-day video snapshots can overlap and repeat the same video. Counts are observations, not independent weeks. Aggregate shares and medians are snapshot-weighted; summed revenue is not unique sales over the publication window.
References
- [1]Szabo, G., & Huberman, B. A. (2010). Predicting the popularity of online content. Communications of the ACM, 53(8), 80–88. cacm.acm.org/research/predicting-the-popularity-of-online-content
- [2]Lewis, R. A., & Rao, J. M. (2015). The unfavorable economics of measuring the returns to advertising. The Quarterly Journal of Economics, 130(4), 1941–1973.
Cite as
MediaLabs Research, in collaboration with Coherence Limited (2026). When to refresh UGC: planning around video shelf life. ContentIQ Working Paper CIQ-WP-2026-69, version 1. https://medialabs-co.com/research/ugc-content-refresh
Analysis and data: Coherence Research, Coherence ContentIQ. Published by MediaLabs in collaboration with Coherence Limited.
Version history
- Version 118 Oct 2026This version