ContentIQ working paperCIQ-WP-2026-68CreativeVersion 118 Oct 2026
UGC production style: polished or everyday footage
51,843 videos tracked, 9,285 analysed in depth, 19 Sept–18 Oct 2026
MediaLabs Research · in collaboration with Coherence Limited
Key findings
- 0189.5%of watched-video sales came from filmed live action videos
- 021.0×sales per view for filmed live action (90% range 1.00–1.04), essentially the market average
- 030.8×sales per view for photo slideshows (0.78–0.89), below the market average
- 042.1×sales per view for AI avatar presenters (1.6–2.7), but on only 14 videos and 0.2% of sales
- 051.2×sales per view for review or testimonial videos (1.12–1.22), which held 14.1% of sales
- 060.96×sales per view for demo or tutorial videos (0.94–0.99), the largest format at 36% of sales
Contents
Abstract
Our analysis of US TikTok Shop compares how top-selling videos are produced and what they show. Filmed live action accounted for 89.5% of watched-video sales and sold at about the market average (1.0× sales per view, 90% range 1.00–1.04). Photo slideshows (0.8×) and mixed media (0.8×) sold below average, while AI avatar presenters (2.1×) and AI-generated footage (1.5×) sold above it, on very few videos. Observed indices also vary across video formats, but all results are associations from observed videos, and the taxonomy cannot separate polished from everyday footage.
1. Introduction
The short answer for a brand deciding between polished and everyday footage: our data does not measure polish, so it cannot rank the two. What it does show is that, in US TikTok Shop, filmed live action carries nearly all sales (89.5%) at roughly average sales per view (1.0×), while video formats such as review, unboxing and voice-over B-roll also show different observed indices. Start with filmed footage and spend your effort choosing the format.
The question matters because production choices are among the few things a brand or creator controls before posting. Whether to commission a staged shoot, brief a creator to film at home, or try AI-generated material affects budget and speed, and it is rarely clear what the market rewards.
Prior work on short-video popularity finds that attention is long-tailed and that early popularity predicts later popularity [1], and that creator features tend to matter most in popularity prediction [2]. Measuring the returns to advertising from observational data is also hard [3]. We therefore describe associations only. These are US TikTok Shop observations, not all user-generated content everywhere.
2. Data
The window runs from 19 September to 18 October 2026. We tracked 51,843 videos across 29 categories, and our AI analyst watched and analysed 9,285 of them in depth. 'Watched' counts videos analysed, not views.
For each analysed video we recorded a production style (filmed live action, photo slideshow, mixed media, AI-generated footage, AI avatar presenter) and a format (for example review or testimonial, demo or tutorial, unboxing, skit). The groups reported here cover fewer videos than were analysed in depth, so some analysed videos fall outside them. Shares of sales refer to sales of watched videos.
Production style describes what is visible on screen. We do not infer production cost, budget or professional involvement from visual style, and this comparison does not include a validated measure of production polish.
Daily rankings of top-selling TikTok Shop videos in the US were collected from several independent sources and merged into one record per video. Where sources overlap, their sales estimates are cross-checked against each other, and videos whose estimates disagree by more than half are flagged. An AI analyst watched each video and recorded its opening, format, angle, production style, use of AI, hook source, length, pacing, what appears in the first second and how it is presented (people on screen, voice-over, setting, UGC or studio feel), without seeing how the video sold. Sales per view is a video group’s revenue per view divided by the market’s, shrunk toward the average for small groups, with 90% ranges. This paper covers 2026-09-19 to 2026-10-18: 51,843 videos tracked, 9,285 of them watched and analysed.
3. Methods
Sales per view compares a group's revenue per view with the market's revenue per view, so 1 is the market average and 1.5 means 50% more revenue per view than average. Estimates for small groups are shrunk toward the average by empirical Bayes [4], and we report 90% intervals computed on the log scale.
Confidence labels (medium or high) accompany each group and reflect how much data supports it. Groups with few videos have wide ranges and medium confidence. We treat ranges that include 1 as consistent with the market average.
4. Results: production style
Filmed live action dominates: 6,631 videos, 89.5% of sales, and 1.0× sales per view (range 1.00–1.04). Photo slideshows (578 videos, 8.4% of sales) sold at 0.8× (0.78–0.89) and mixed media (94 videos, 1.0% of sales) at 0.8× (0.66–0.96); both ranges sit below 1.
Two AI-based styles sold above average. AI avatar presenters reached 2.1× (1.6–2.7) but on 14 videos and 0.2% of sales, with medium confidence. AI-generated footage reached 1.5× (1.3–1.8) on 89 videos and 0.9% of sales, with high confidence. These are small, niche groups, and the results say nothing about how the style would perform at larger scale.
| Value | Videos (n) | Share of sales | Sales per view | 90% range |
|---|---|---|---|---|
| AI avatar presenter | 14 | 0.2% | 2.06× | 1.58–2.70 |
| AI-generated footage | 89 | 0.9% | 1.51× | 1.26–1.81 |
| Filmed live action | 6,631 | 89.5% | 1.02× | 1.00–1.04 |
| Photo slideshow | 578 | 8.4% | 0.83× | 0.78–0.89 |
| Mixed media | 94 | 1% | 0.80× | 0.66–0.96 |
Note. Sales per view is relative to the market (1.00 = average), shrunk toward the average for small groups (empirical Bayes); ranges are 90% intervals on the log scale.
5. Results: format
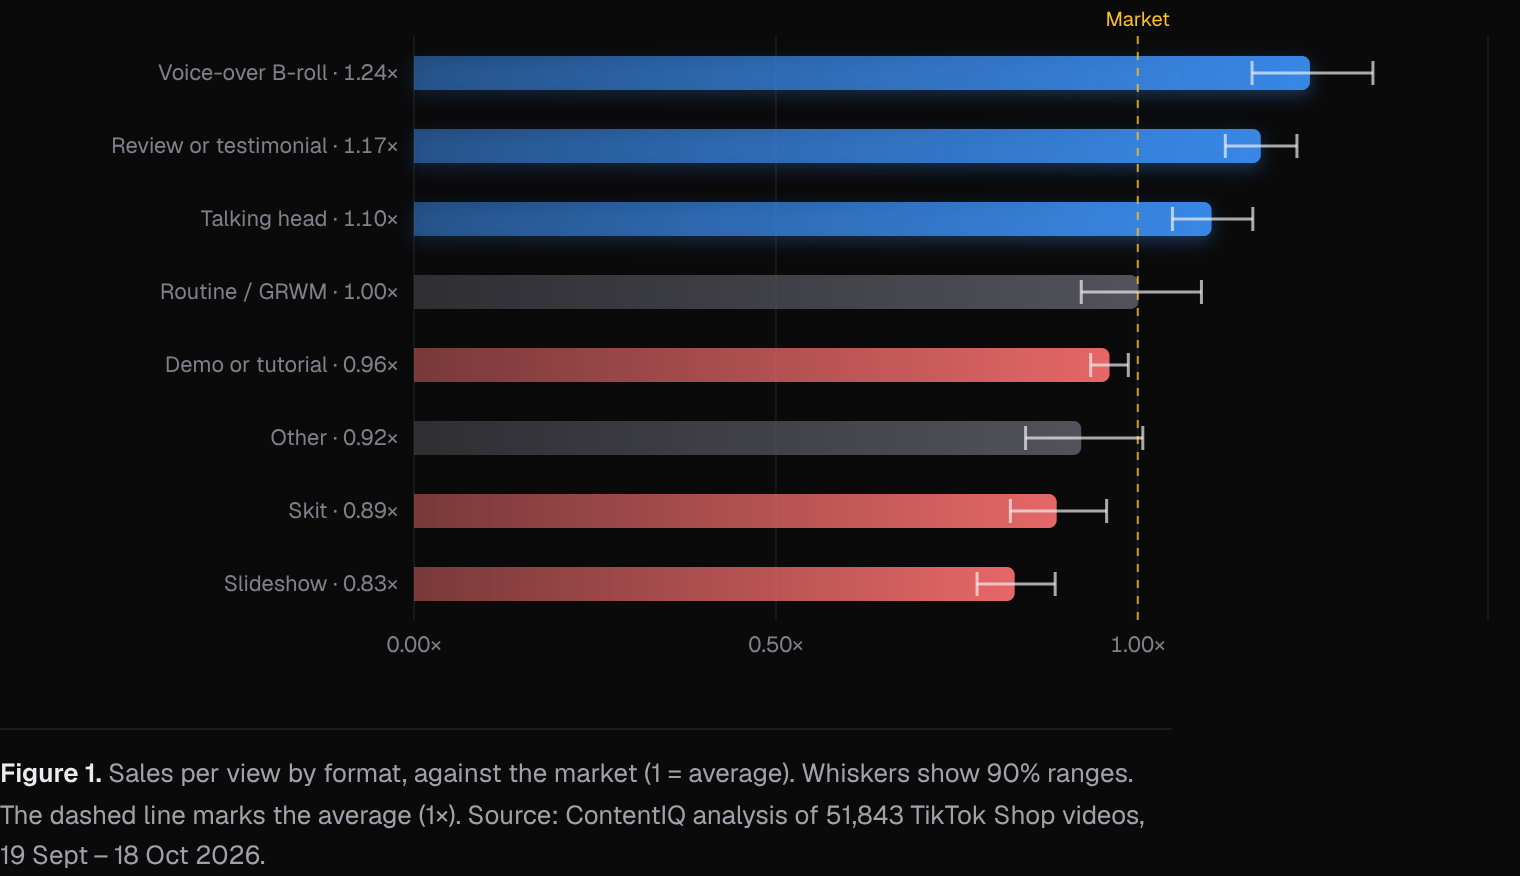
Among formats with larger samples, observed indices vary. Voice-over B-roll (561 videos, 5.8% of sales) sold at 1.2× (1.16–1.33), unboxing (309 videos, 3.2%) at 1.2× (1.10–1.32), and review or testimonial (1,071 videos, 14.1%) at 1.2× (1.12–1.22). Talking head (987 videos, 12.1%) sold at 1.1× (1.05–1.16).
Demo or tutorial is the largest format (3,163 videos, 36% of sales) and sold slightly below average at 0.96× (0.94–0.99). Skits (441 videos, 5.5%) sold at 0.89× (0.82–0.96). Day in the life (1.4×, range 0.86–2.2, 16 videos) and live clip (1.2×, range 0.82–1.7, 35 videos) have medium confidence and ranges that include 1, so we draw no conclusion from them.
6. Discussion
These descriptive production groups do not measure the effect of changing production. The dominant style sold at the market average, and the groups that differ are either small (AI styles) or sell below average (slideshow, mixed media). Format indices also vary: formats built around a person's reaction or a voice explaining footage (review, unboxing, voice-over B-roll) sold above average. Alternative explanations include differences in product category, price, creator audience and paid promotion, none of which this comparison controls for. Observational data of this kind cannot establish returns [3].
Recommendation, not a finding: a simple test plan. (1) Pick one product and keep price, offer and posting window the same. (2) Brief two or three filmed versions in different formats, such as review or testimonial, unboxing and voice-over B-roll, while holding the other briefing choices fixed. (3) Where you also want to try a slideshow or AI-generated version, keep it as a separate, clearly labelled variant. (4) Decide in advance the metric (revenue per view) and the minimum number of posts per variant. (5) Review results after the pre-set period and keep the format that does better for your own audience, rather than relying on market averages.
In this window, the 'everyday' look (a person filming at home) cannot be separated from the 'polished' look, because visual polish was not measured. Treat the above only as a way to test your own assumptions.
7. What this means for brands and founders
- Default to filmed footage and choose the format carefully: filmed live action held 89.5% of watched-video sales at 1.0× sales per view, while review or testimonial videos sold at 1.2× (range 1.12–1.22).
- Be cautious with photo slideshows: they sold at 0.8× sales per view (range 0.78–0.89), below the market average, so test them against a filmed version before committing budget.
- Treat AI avatar presenters as an experiment only: they sold at 2.1× (range 1.6–2.7), but on 14 videos and 0.2% of sales, so the evidence is thin.
- Test voice-over B-roll or unboxing alongside demos: both sold at 1.2× sales per view, while demo or tutorial, the largest format at 36% of sales, sold at 0.96×.
- Do not read production polish into these numbers: the taxonomy records on-screen style, not cost or professional involvement, so run your own side-by-side test.
8. Conclusion
In our US TikTok Shop observations, filmed live action carried 89.5% of watched-video sales at roughly average sales per view (1.0×). Photo slideshows and mixed media sold at about 0.8×. AI avatar presenters (2.1×) and AI-generated footage (1.5×) sold above average but on 14 and 89 videos only.
Format and production describe different groupings; this analysis does not establish which matters more. We cannot say whether polished or everyday footage sells better, because this comparison does not measure polish. The findings are associations from one 30-day window and should be tested against a brand's own results.
Methodology
Daily rankings of top-selling TikTok Shop videos in the US were collected from several independent sources and merged into one record per video. Where sources overlap, their sales estimates are cross-checked against each other, and videos whose estimates disagree by more than half are flagged. An AI analyst watched each video and recorded its opening, format, angle, production style, use of AI, hook source, length, pacing, what appears in the first second and how it is presented (people on screen, voice-over, setting, UGC or studio feel), without seeing how the video sold. Sales per view is a video group’s revenue per view divided by the market’s, shrunk toward the average for small groups, with 90% ranges. This paper covers 2026-09-19 to 2026-10-18: 51,843 videos tracked, 9,285 of them watched and analysed.
Limitations
Most videos in the sample are top-ranked, so findings mostly separate strong sellers from good ones rather than from all videos; typical and weak videos are being added. Results are associations, not causes. Paid promotion, creator audience size and product price are not fully controlled for. Revenue, views and sales are estimates, not figures reported by TikTok. The analysis is observational and covers one 30-day window in US TikTok Shop, so it describes associations rather than effects and may not hold in other periods or markets. Production style and format were assigned by an AI analyst from what is visible; the taxonomy does not measure polish, budget or whether a professional was involved. Several groups are small (AI avatar presenter 14 videos, day in the life 16, live clip 35, AI-generated footage 89), with wide ranges and medium confidence for some. The groups shown cover fewer videos than were analysed in depth. Product category, price, creator audience and paid promotion are not controlled for.
References
- [1]Szabo, G., & Huberman, B. A. (2010). Predicting the popularity of online content. Communications of the ACM, 53(8), 80–88. cacm.acm.org/research/predicting-the-popularity-of-online-content
- [2]Ye, L., Zhang, Y., Wu, Y., et al. (2025). MVP: Winning solution to SMP Challenge 2025 video track. arXiv:2507.00950. arxiv.org/abs/2507.00950
- [3]Lewis, R. A., & Rao, J. M. (2015). The unfavorable economics of measuring the returns to advertising. The Quarterly Journal of Economics, 130(4), 1941–1973.
- [4]Efron, B., & Morris, C. (1975). Data analysis using Stein’s estimator and its generalizations. Journal of the American Statistical Association, 70(350), 311–319.
Cite as
MediaLabs Research, in collaboration with Coherence Limited (2026). UGC production style: polished or everyday footage. ContentIQ Working Paper CIQ-WP-2026-68, version 1. https://medialabs-co.com/research/ugc-production-style
Analysis and data: Coherence Research, Coherence ContentIQ. Published by MediaLabs in collaboration with Coherence Limited.
Version history
- Version 118 Oct 2026This version