ContentIQ working paperCIQ-WP-2026-15CreativeVersion 11 Oct 2026
Top-selling TikTok Shop videos that prompt comments or show the orange cart sell more per view than those with no call to action
13,304 videos tracked, 3,342 analysed in depth, 29 categories, 2 Sept–1 Oct 2026
MediaLabs Research · in collaboration with Coherence Limited
Key findings
- 011.08×sales per view for orange cart videos (90% range 1.04–1.12), against a market average of 1
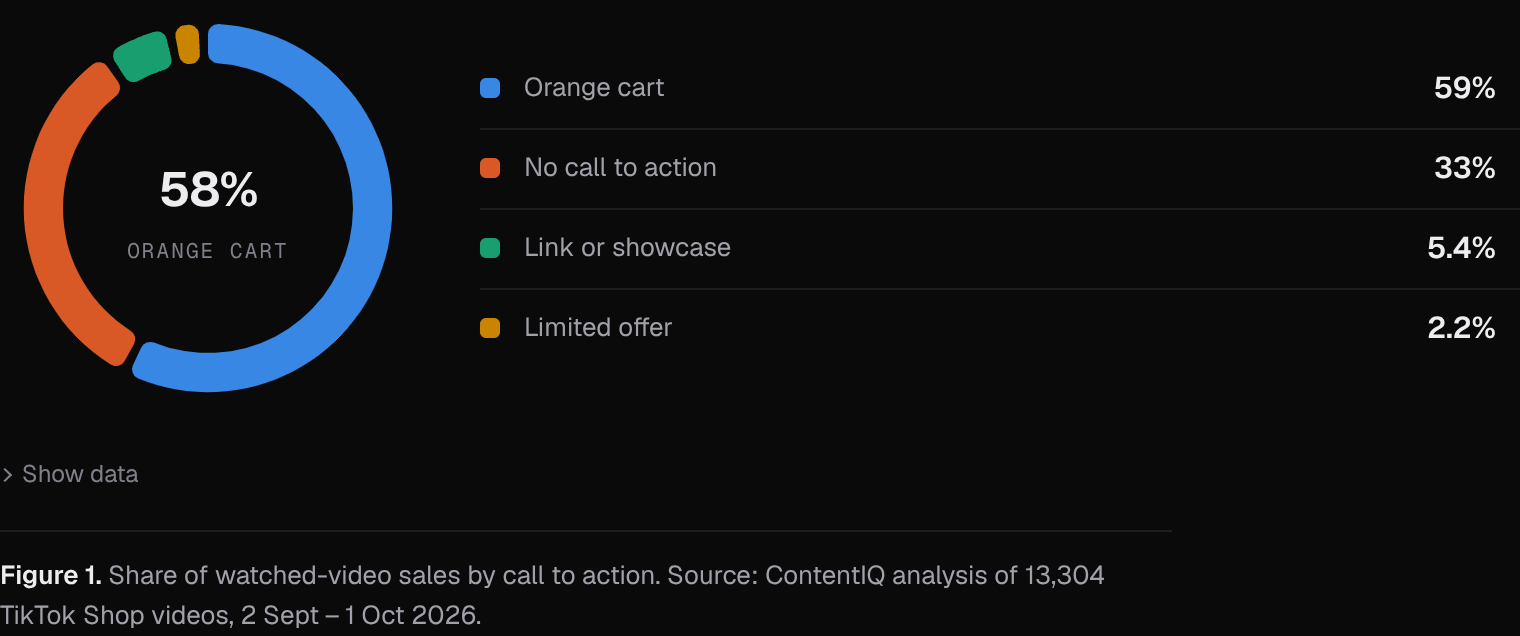
- 0258%of watched-video sales came from videos using the orange cart
- 030.90×sales per view for videos with no call to action (0.85–0.94), 33% of sales
- 041.39×sales per view for comment prompts (1.14–1.70), from only 45 videos
- 050.86×sales per view for link or showcase prompts (0.76–0.96)
- 060.64AUC of our predictive model (0.57–0.70)
Contents
Abstract
We compared how top-selling TikTok Shop videos ask for the sale and how much each approach sells per view relative to the market. Videos using the orange cart sold at 1.08× the market average (90% range 1.04–1.12) and accounted for 58% of sales among watched videos, while videos with no call to action sold at 0.90× (0.85–0.94). Comment prompts had the highest estimate, 1.39× (1.14–1.70), but rest on only 45 videos. A time-split model of top-selling videos reached an AUC of 0.64 (0.57–0.70), so call to action is a modest signal at best.
1. Introduction
Every TikTok Shop video has to decide how to ask for the sale: point to the orange cart, send viewers to a showcase, announce a limited offer, invite a comment, or say nothing. For brands briefing creators and creators scripting videos, this is one of the cheapest choices to change. The question is whether some calls to action are associated with more sales per view than others.
Prior work on short-video popularity shows that attention is long-tailed and that early popularity predicts later popularity [1]. Recent benchmark and challenge work finds that creator features matter most in popularity prediction, with multimodal content features adding to them [2, 3]. These studies predict views and engagement rather than sales, and they say little about how a video asks for a purchase.
Measuring the returns to advertising from observational data is also hard, because exposure is not random [4]. We therefore describe associations only. We cannot say that a call to action causes more or fewer sales.
2. Data
Our analysis tracked 13,304 TikTok Shop videos between 2 September and 1 October 2026, across 29 categories. Of these, 3,342 were watched and analysed in depth by our AI analyst. Watched is a count of videos, not of views.
For each analysed video we recorded how it asked for the sale (orange cart, link or showcase, limited offer, comment prompt, or no call to action), its format, and a set of visual and production features. Sales and views come from the tracked marketplace figures.
The window is a single month, so seasonal effects and any retail moments inside it are not separated out.
Daily rankings of top-selling TikTok Shop videos in the US were collected from several independent sources and merged into one record per video. Where sources overlap, their sales estimates are cross-checked against each other, and videos whose estimates disagree by more than half are flagged. An AI analyst watched each video and recorded its opening, format, angle, production style, use of AI, hook source, length, pacing and what appears in the first second, without seeing how the video sold. Sales per view is a video group’s revenue per view divided by the market’s, shrunk toward the average for small groups, with 90% ranges. This paper covers 2026-09-02 to 2026-10-01: 13,304 videos tracked, 3,342 of them watched and analysed. Predictions come from a logistic model retrained daily and tested on recent weeks it had not seen.
3. Methods
Sales per view compares a group of videos' revenue per view with the market's revenue per view, so 1 is the market average. For small groups, estimates are shrunk toward the average by empirical Bayes [5], and we report 90% intervals computed on the log scale. Shrinkage pulls thin groups toward 1, so their ranges should be read with care.
The predictive model is a logistic model of whether a video is among the top sellers. It is retrained daily and tested on recent weeks it had not seen (a time split). We report discrimination as AUC, a ranking measure [6], with a bootstrap 90% range [7]. The model was trained on 2,667 rows.
4. Results: sales per view by call to action
Comment prompts had the highest sales per view at 1.39× the market (90% range 1.14–1.70), but only 45 videos and 1.3% of sales stand behind that estimate. Orange cart videos sold at 1.08× (1.04–1.12) across 1,782 videos, and the narrow range reflects the larger sample.
Limited offers sat at the average, 0.99× (0.81–1.21), with 60 videos, and the range comfortably includes both higher and lower values. Videos with no call to action sold at 0.90× (0.85–0.94) across 1,137 videos. Link or showcase prompts were lowest at 0.86× (0.76–0.96) across 187 videos.
The ranges for orange cart and for no call to action do not overlap. The gap is small, about 0.19 index points between the two estimates, and it is an association in this sample.
| Value | Videos (n) | Share of sales | Sales per view | 90% range |
|---|---|---|---|---|
| Comment prompt | 45 | 1.3% | 1.39× | 1.14–1.70 |
| Orange cart | 1,782 | 58.3% | 1.08× | 1.04–1.12 |
| Limited offer | 60 | 2.2% | 0.99× | 0.81–1.21 |
| No call to action | 1,137 | 32.9% | 0.90× | 0.85–0.94 |
| Link or showcase | 187 | 5.3% | 0.85× | 0.76–0.96 |
Note. Sales per view is relative to the market (1.00 = average), shrunk toward the average for small groups (empirical Bayes); ranges are 90% intervals on the log scale.
5. Results: where the sales come from
Share of sales and sales per view tell different stories. The orange cart accounted for 58% of watched-video sales, and videos with no call to action for 33%. Link or showcase prompts contributed 5.3%, limited offers 2.2% and comment prompts 1.3%.
The orange cart's lead is therefore mostly about volume: it is by far the most common approach, with a modest per-view advantage. Comment prompts are the opposite, with a high per-view estimate on a very small base.
A third of sales came from videos that did not ask at all. These sold at slightly below the market average per view, which suggests that dropping the call to action is associated with a small penalty rather than a collapse.
6. Results: format as a competing explanation
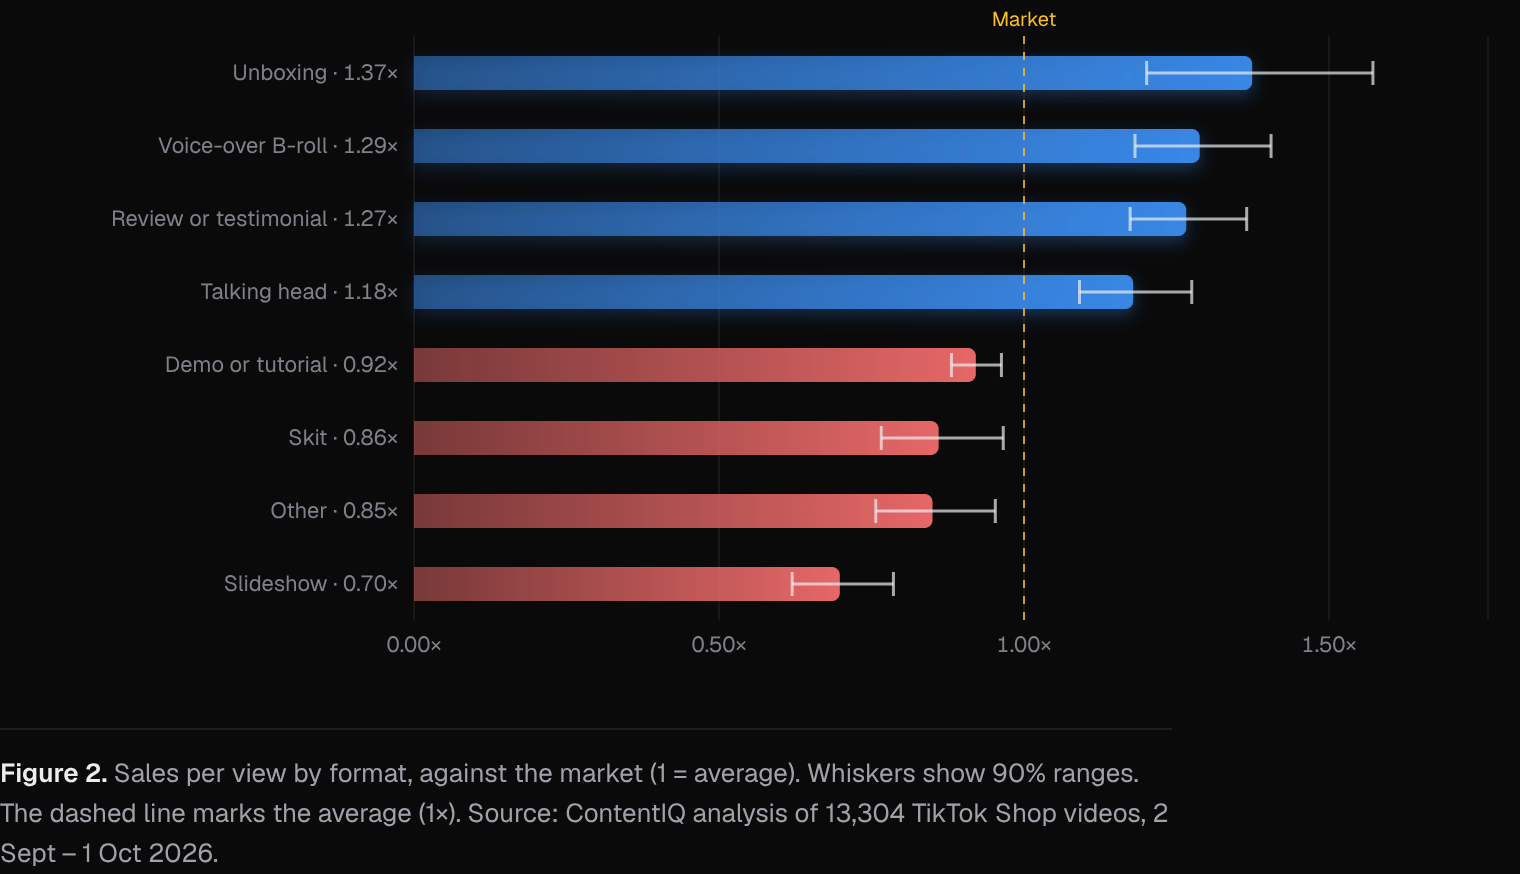
Call to action does not occur in isolation from format. Unboxing videos sold at 1.37× the market (1.20–1.57), voice-over B-roll at 1.29× (1.18–1.41), and reviews or testimonials at 1.27× (1.17–1.37). Demos and tutorials, the largest format at 34% of sales, sold at 0.92× (0.88–0.96), and skits at 0.86× (0.77–0.97).
The format spread, from 0.86× to 1.37× among well-sampled formats, is wider than the spread among the calls to action with large samples. Several format groups are thin: day in the life has 8 videos and low confidence, and green screen has 20 videos and medium confidence.
If some calls to action are more often paired with stronger formats, part of the call-to-action gap could reflect format. Our tables do not separate the two.
7. Discussion
For brands, the evidence supports using a clear call to action, with the orange cart as the default, over leaving the ask implicit. The per-view edge is modest, 1.08× against 0.90× for no call to action, and the format a video uses appears to matter at least as much. Comment prompts merit testing, since their estimate is the highest, but 45 videos do not justify a firm conclusion.
The predictive model gives a similar message. It reached an AUC of 0.64 (0.57–0.70), where 0.5 is chance, so it ranks top sellers only somewhat better than chance. It was not trained only on analyses that never saw sales (cleanOnly is false), so its figures could be flattered by that. Its largest odds ratios were filmed live action (2.54), a visual pattern-break combined with a review or testimonial (1.92), and no visible AI (1.71). None of the ten listed drivers was a call to action.
This is consistent with prior work in which creator and content features dominate popularity prediction [2]. Alternative explanations include creator size, product price and category mix, and the fact that the orange cart is only available to certain sellers and products. Because exposure is not random, we cannot separate the effect of the call to action from who chooses it [4].
8. Conclusion
Among top-selling TikTok Shop videos in September 2026, those using the orange cart sold at 1.08× the market per view and made up most sales, while videos with no call to action sold at 0.90× and link or showcase prompts at 0.86×. Comment prompts looked strongest at 1.39× but rest on thin data.
These are associations from one month of observational data. Call to action is a small part of the picture next to format and production style, and the model's modest AUC of 0.64 says the same. Brands and creators should treat the orange cart as a sensible default and test comment prompts and formats rather than expect large gains from the call to action alone.
Methodology
Daily rankings of top-selling TikTok Shop videos in the US were collected from several independent sources and merged into one record per video. Where sources overlap, their sales estimates are cross-checked against each other, and videos whose estimates disagree by more than half are flagged. An AI analyst watched each video and recorded its opening, format, angle, production style, use of AI, hook source, length, pacing and what appears in the first second, without seeing how the video sold. Sales per view is a video group’s revenue per view divided by the market’s, shrunk toward the average for small groups, with 90% ranges. This paper covers 2026-09-02 to 2026-10-01: 13,304 videos tracked, 3,342 of them watched and analysed. Predictions come from a logistic model retrained daily and tested on recent weeks it had not seen.
Limitations
Most videos in the sample are top-ranked, so findings mostly separate strong sellers from good ones rather than from all videos; typical and weak videos are being added. Results are associations, not causes. Paid promotion, creator audience size and product price are not fully controlled for. Revenue, views and sales are estimates, not figures reported by TikTok. Comment prompts (45 videos), limited offers (60) and several formats are small samples, so their ranges are wide even where confidence is labelled high. The data cover one 30-day window and only top-selling videos, so results may not describe all TikTok Shop content. Call to action and format are analysed separately, and the model was not trained only on analyses that never saw sales.
References
- [1]Szabo, G., & Huberman, B. A. (2010). Predicting the popularity of online content. Communications of the ACM, 53(8), 80–88. cacm.acm.org/research/predicting-the-popularity-of-online-content
- [2]Ye, L., Zhang, Y., Wu, Y., et al. (2025). MVP: Winning solution to SMP Challenge 2025 video track. arXiv:2507.00950. arxiv.org/abs/2507.00950
- [3]Lu, J., Wang, W., Xiao, M., et al. (2024). M3TR: Temporal retrieval enhanced multi-modal micro-video popularity prediction. arXiv:2411.15455. arxiv.org/abs/2411.15455
- [4]Lewis, R. A., & Rao, J. M. (2015). The unfavorable economics of measuring the returns to advertising. The Quarterly Journal of Economics, 130(4), 1941–1973.
- [5]Efron, B., & Morris, C. (1975). Data analysis using Stein’s estimator and its generalizations. Journal of the American Statistical Association, 70(350), 311–319.
- [6]Fawcett, T. (2006). An introduction to ROC analysis. Pattern Recognition Letters, 27(8), 861–874.
- [7]Efron, B., & Tibshirani, R. J. (1993). An Introduction to the Bootstrap. Chapman & Hall.
Cite as
MediaLabs Research, in collaboration with Coherence Limited (2026). Top-selling TikTok Shop videos that prompt comments or show the orange cart sell more per view than those with no call to action. ContentIQ Working Paper CIQ-WP-2026-15, version 1. https://medialabs-co.com/research/calls-to-action-that-sell
Analysis and data: Coherence Research, Coherence ContentIQ. Published by MediaLabs in collaboration with Coherence Limited.
Version history
- Version 11 Oct 2026This version