ContentIQ working paperCIQ-WP-2026-05CategoryVersion 11 Oct 2026
In Beauty, bold claims and filmed footage sell more per view than trend hooks and slideshows
Our analysis of 1,456 top-selling Beauty & Personal Care videos on TikTok Shop, 234 analysed in depth, 2 September to 1 October 2026
MediaLabs Research · in collaboration with Coherence Limited
Key findings
- 011.2×Sales per view for bold-claim hooks, which carry 22% of sales (range 0.99–1.48)
- 020.68×Sales per view for trend-or-sound hooks, the only hook clearly below average (range 0.50–0.92)
- 030.73×Sales per view for slideshows (range 0.56–0.95)
- 0488%Share of sales from filmed live-action videos
- 0588–89Seasonal index for October and November, before a December rise to 110
- 060.64Model AUC for ranking top sellers (range 0.57–0.70)
Contents
Abstract
We ask which openings, formats and production styles are associated with higher sales per view among top-selling Beauty & Personal Care videos on TikTok Shop, and what the seasonal pattern implies for the months ahead. Bold-claim and relatable-POV hooks carry the largest shares of sales and sell at about 1.2× the market average per view, while trend-or-sound hooks sell at 0.68× (90% range 0.50–0.92). Slideshows and photo-slideshow production sell at roughly 0.73× per view, and filmed live action accounts for 88% of sales. A predictive model ranks videos only modestly well (AUC 0.64, range 0.57–0.70), and the one-month window and small groups mean most hook and format estimates should be read as directional.
1. Introduction
Beauty & Personal Care sellers and creators make many decisions before a video is posted: how to open, which format to use, whether to film or assemble a slideshow. This paper asks which of those choices are associated with more sales per view among top-selling TikTok Shop videos in the category, and what the category's seasonal pattern suggests for the coming months.
The question matters because attention on short-video platforms is long-tailed and early popularity tends to predict later popularity [1], so views alone say little about how efficiently a video converts. Measuring sales relative to views separates the creative choices that sell from those that simply reach people.
Prior work on short-video popularity has focused on predicting views or engagement. Multimodal benchmarks show that content signals carry predictive information [2], while the strongest recent systems find that creator features matter most [3]. We look instead at sales, and at creative attributes a brand or creator can choose.
2. Data
The sample consists of 1,456 top-selling Beauty & Personal Care videos on TikTok Shop observed between 2 September and 1 October 2026. Of these, 234 were analysed in depth. Market-level baselines draw on 3,340 analysed videos across categories, so an index of 1 represents the market average.
For each analysed video we recorded the opening hook type, the format, the production style (filmed live action or photo slideshow), and further attributes used by the predictive model, such as whether the product appears in the first second, whether AI is visibly used, and whether the video was boosted with ads. Not every analysed video received a classification on every attribute, so group sizes differ by dimension.
The window covers one month, and many hook and format groups contain fewer than 15 videos. Monthly seasonal indices describe the category's sales against its own average and are reported separately from the creative analysis.
Daily rankings of top-selling TikTok Shop videos, products and categories in the US were collected from several independent sources and merged into one record per video. Where sources overlap, their sales estimates are cross-checked against each other, and videos whose estimates disagree by more than half are flagged. An AI analyst watched each video and recorded its opening, format, angle, production style, use of AI and hook source, without seeing how the video sold. Sales per view is a video group's revenue per view divided by the market's, shrunk toward the average for small groups, with 90% ranges. This paper covers 2026-09-02 to 2026-10-01: 1,456 videos tracked in Beauty & Personal Care, 234 of them watched and analysed; the market baseline uses all 3,340 watched videos. Predictions come from a logistic model retrained daily and tested on recent weeks it had not seen.
3. Methods
Our main measure is a sales-per-view index: a group's sales per view divided by the market average, so 1 means average and 1.2 means 20% above. Because small groups produce noisy ratios, each estimate is shrunk toward the market mean using empirical-Bayes methods [4]; groups with few videos are pulled more strongly toward 1. We report 90% intervals and a confidence label (low, medium, high) that reflects group size and interval width.
To test whether creative attributes jointly predict top-selling status, we trained a predictive model on 2,667 rows and evaluated it with a time split, training on earlier videos and testing on later ones. Performance is summarised by the area under the ROC curve (AUC), which measures how well the model ranks top sellers above others, where 0.5 is chance [5]. The AUC range is a bootstrap interval [6]. Model drivers are reported as odds ratios.
The model was not restricted to analyses that never saw sales (cleanOnly is false). Some attribute labels may therefore have been produced with knowledge of performance, which could inflate the AUC and the driver odds ratios.
4. Results: Openings
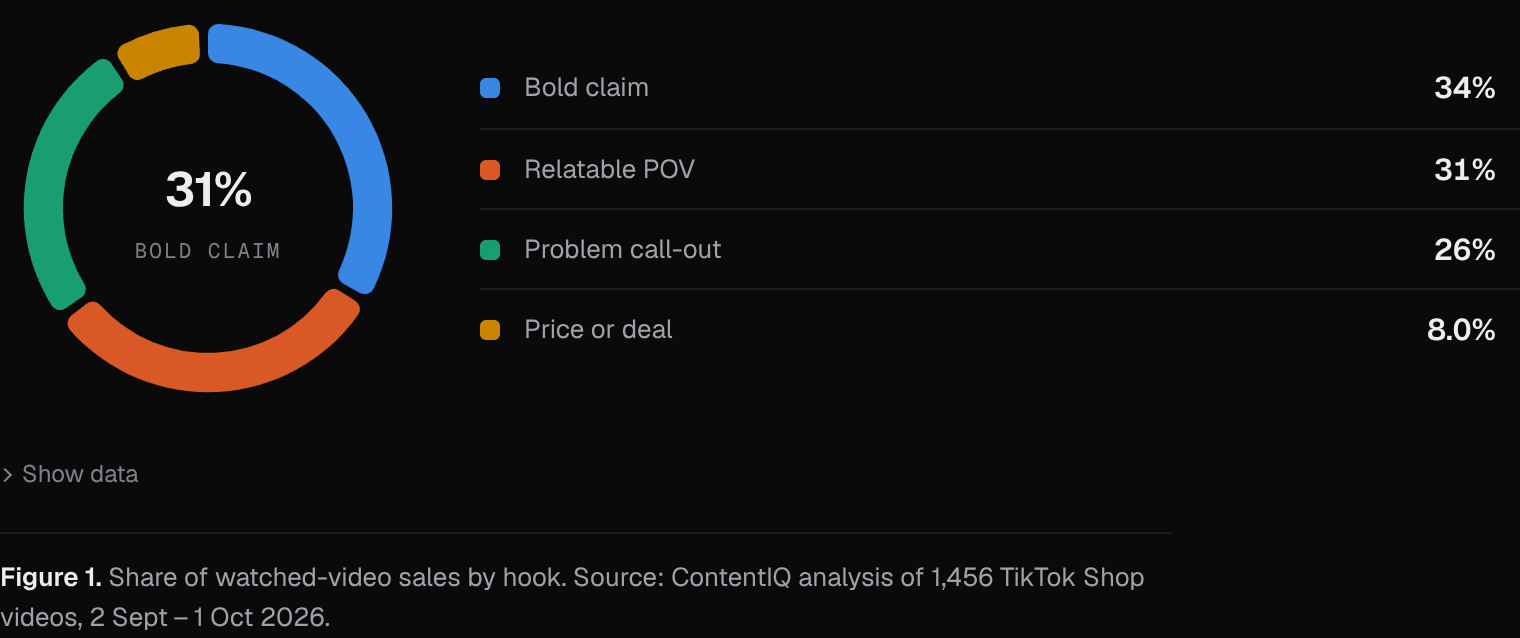
Two hooks dominate sales. Bold-claim openings (33 videos) carry 22% of sales and sell at 1.21× the market per view (90% range 0.99–1.48); relatable-POV openings (35 videos) carry 21% and sell at 1.18× (0.97–1.43). Both are high-confidence estimates whose ranges sit mostly above 1. Problem call-outs (27 videos) carry 17% of sales at 1.06× (0.86–1.32), close to average.
At the low end, trend-or-sound hooks (15 videos) sell at 0.68× per view (0.50–0.92), the only hook whose range lies wholly below average. Visual pattern-breaks (0.73×, 0.51–1.05) and test-or-challenge openings (0.76×, 0.54–1.07) also point below average, but their ranges reach 1.
Price-or-deal openings show the highest point estimate at 1.31× (0.84–2.03), but rest on 7 videos and are low confidence. Social proof, questions, straight-into-demo and result-first openings each have 8 or fewer videos and ranges that straddle 1; we treat them as unresolved.
| Value | Videos (n) | Share of sales | Sales per view | 90% range |
|---|---|---|---|---|
| Price or deal | 7 | 5.2% | 1.31× | 0.84–2.03 |
| Bold claim | 33 | 22.3% | 1.21× | 0.99–1.48 |
| Relatable POV | 35 | 20.5% | 1.18× | 0.97–1.43 |
| Social proof | 7 | 4.3% | 1.11× | 0.81–1.53 |
| Question | 7 | 3.7% | 1.08× | 0.67–1.72 |
| Problem call-out | 27 | 17.1% | 1.06× | 0.86–1.32 |
| Straight into the demo | 8 | 4.3% | 1.06× | 0.78–1.45 |
| Result first | 8 | 4.9% | 1.00× | 0.73–1.36 |
| Test or challenge | 6 | 3.5% | 0.76× | 0.54–1.06 |
| Visual pattern-break | 11 | 6.5% | 0.73× | 0.51–1.05 |
Note. Sales per view is relative to the market (1.00 = average), shrunk toward the average for small groups (empirical Bayes); ranges are 90% intervals on the log scale.
5. Results: Formats and production
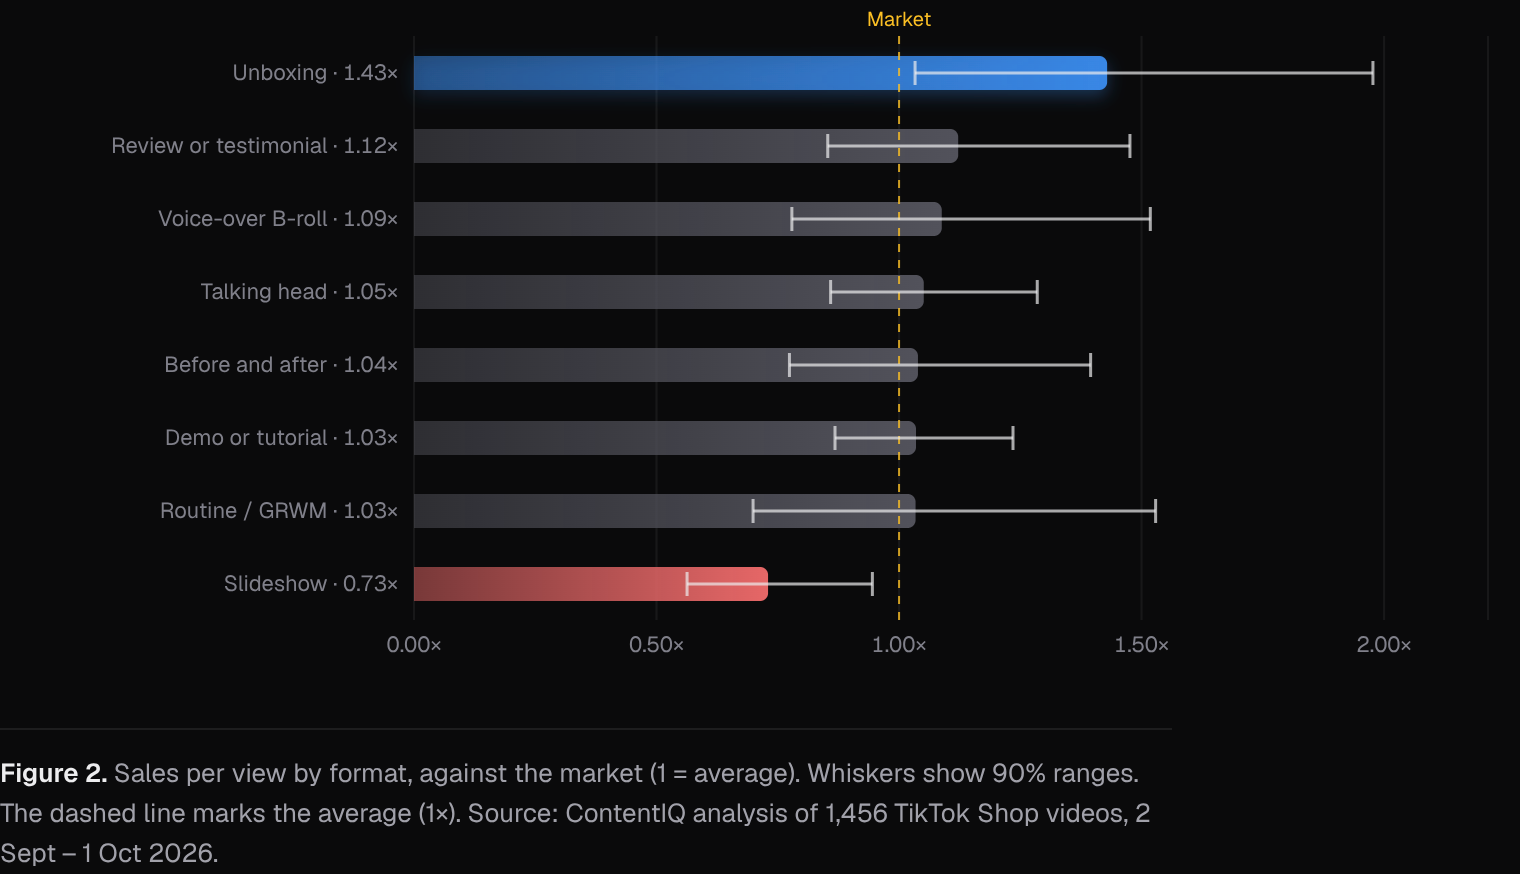
Demo or tutorial (49 videos, 29% of sales) and talking head (37 videos, 26%) are the largest formats and sell close to average, at 1.04× (0.87–1.24) and 1.05× (0.86–1.29). Reviews or testimonials (1.12×, 0.85–1.48), voice-over B-roll (1.09×, 0.78–1.52) and before-and-after (1.04×, 0.77–1.40) are similar, with ranges spanning 1.
Slideshows stand out on the downside: 21 videos, 11% of sales, at 0.73× per view (0.56–0.95). The production split tells the same story. Filmed live action (134 videos) accounts for 88% of sales at 1.09× (0.97–1.21), while photo slideshows (22 videos) account for 12% at 0.74× (0.57–0.94).
Unboxing videos show the highest format estimate, 1.43× (1.03–1.98), with a range above 1, but this rests on 7 videos and is low confidence. The predictive model points the same way on production: filmed live action has the largest driver odds ratio (2.54), and no visible AI is associated with higher odds (1.71). Other drivers include before-and-after (1.66) and boosting with ads (1.59), while an education angle (0.59) and showing the product in the first second (0.62) are associated with lower odds. The model's AUC of 0.64 (range 0.57–0.70) indicates modest ranking ability, and because it was not trained only on sales-blind analyses, these odds ratios should be read cautiously.
6. Results: The season ahead
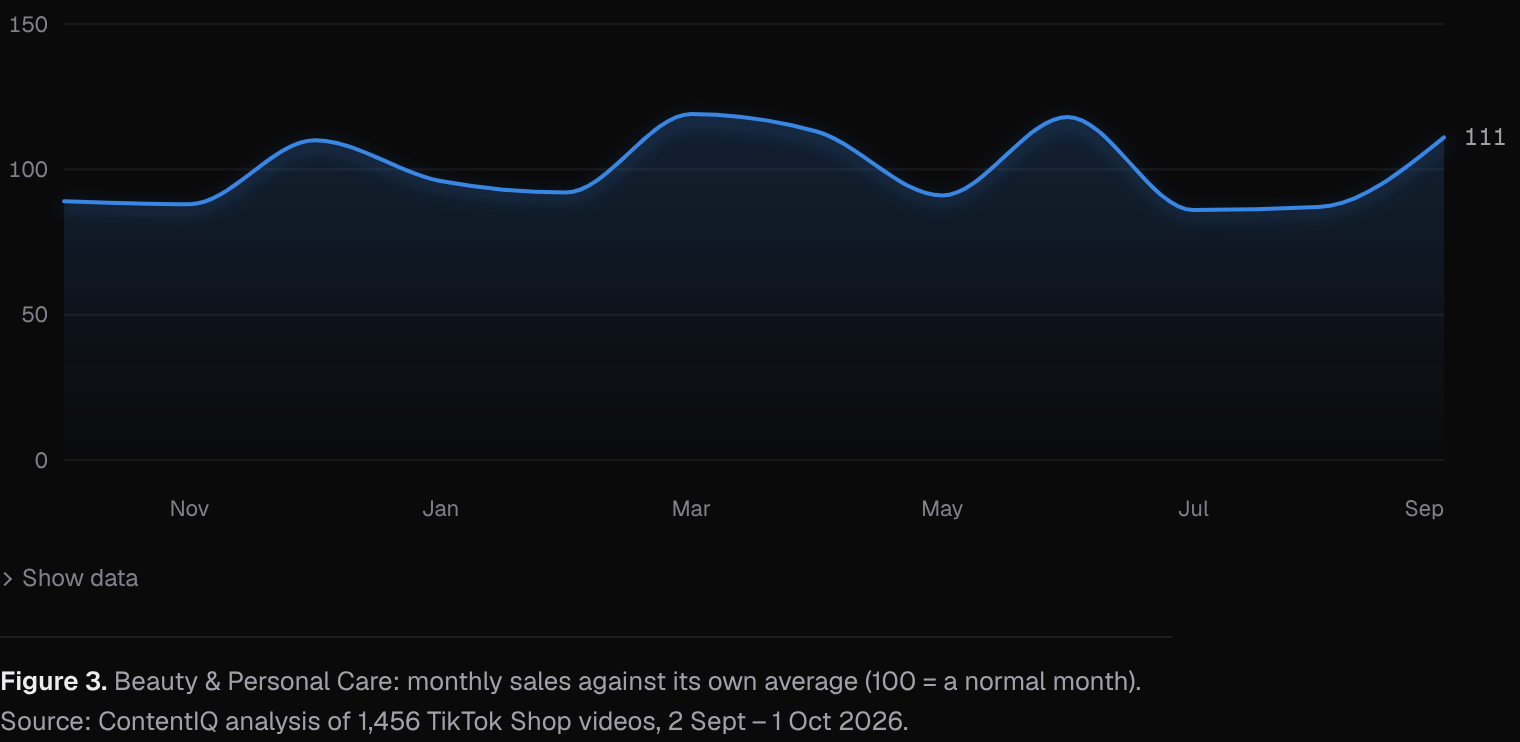
Against its own average (100 = a normal month), Beauty & Personal Care sales run below normal in October (89) and November (88), then rise to 110 in December. January (96) and February (92) are again below normal.
The strongest months in the index are March (119), June (118) and April (113), with September at 111. July (86) and August (87) are the weakest. The category therefore does not peak only in the holiday period; spring and early summer are at least as strong as December.
7. Discussion
For creators and brands, the evidence points to direct, filmed openings. Bold claims and relatable POVs both carry large shares of sales and sell above average per view, while trend-or-sound hooks sell well below it. Slideshow formats and photo-slideshow production sell at about three-quarters of the market rate per view. Within filmed formats, the common choices (demo, talking head, review, before-and-after) sit close to average, which suggests the opening and production style separate performance more than the format label does.
These results complement prior work. Popularity research finds that creator features matter most for reach [3], and our model's modest AUC is consistent with creative attributes explaining only part of sales outcomes. Long-tailed attention [1] means a few videos drive much of the sales, which is why per-view yield rather than raw sales is the more comparable measure across groups.
Alternative explanations remain. Hook and format choices may proxy for creator size, product price or ad spend; boosting with ads is itself associated with higher odds in the model. Slideshows may be used more often for lower-priced or less-established products. The one-month window falls in a single season, and labels used by the model may not be fully independent of sales.
8. Conclusion
Among top-selling Beauty & Personal Care videos on TikTok Shop, bold-claim and relatable-POV openings sell at about 1.2× the market per view, trend-or-sound hooks at 0.68×, and slideshows at about 0.73×. Filmed live action carries 88% of sales.
The seasonal index points to a softer October and November before a December rise, with spring and early summer the strongest periods. Given the short window, small groups for several hooks and formats, and a model of modest accuracy not limited to sales-blind analyses, these findings are best used as testable priors rather than rules.
Methodology
Daily rankings of top-selling TikTok Shop videos, products and categories in the US were collected from several independent sources and merged into one record per video. Where sources overlap, their sales estimates are cross-checked against each other, and videos whose estimates disagree by more than half are flagged. An AI analyst watched each video and recorded its opening, format, angle, production style, use of AI and hook source, without seeing how the video sold. Sales per view is a video group's revenue per view divided by the market's, shrunk toward the average for small groups, with 90% ranges. This paper covers 2026-09-02 to 2026-10-01: 1,456 videos tracked in Beauty & Personal Care, 234 of them watched and analysed; the market baseline uses all 3,340 watched videos. Predictions come from a logistic model retrained daily and tested on recent weeks it had not seen.
Limitations
Most videos in the sample are top-ranked, so findings mostly separate strong sellers from good ones rather than from all videos; typical and weak videos are being added. Results are associations, not causes. Paid promotion, creator audience size and product price are not fully controlled for. Revenue and views are estimates, not figures reported by TikTok. The window covers one month (2 September to 1 October 2026), so creative estimates reflect a single seasonal period. Many hook and format groups contain 6 to 8 videos and are rated low confidence, including the highest point estimates (price-or-deal, unboxing). The predictive model was not trained only on analyses that never saw sales, which may inflate its AUC and driver odds ratios. All results are correlational and may reflect creator size, product price or ad spend rather than the creative choices themselves.
References
- [1]Szabo, G., & Huberman, B. A. (2010). Predicting the popularity of online content. Communications of the ACM, 53(8), 80–88. cacm.acm.org/research/predicting-the-popularity-of-online-content
- [2]Lu, J., Wang, W., Xiao, M., et al. (2024). M3TR: Temporal retrieval enhanced multi-modal micro-video popularity prediction. arXiv:2411.15455. arxiv.org/abs/2411.15455
- [3]Ye, L., Zhang, Y., Wu, Y., et al. (2025). MVP: Winning solution to SMP Challenge 2025 video track. arXiv:2507.00950. arxiv.org/abs/2507.00950
- [4]Efron, B., & Morris, C. (1975). Data analysis using Stein’s estimator and its generalizations. Journal of the American Statistical Association, 70(350), 311–319.
- [5]Fawcett, T. (2006). An introduction to ROC analysis. Pattern Recognition Letters, 27(8), 861–874.
- [6]Efron, B., & Tibshirani, R. J. (1993). An Introduction to the Bootstrap. Chapman & Hall.
Cite as
MediaLabs Research, in collaboration with Coherence Limited (2026). In Beauty, bold claims and filmed footage sell more per view than trend hooks and slideshows. ContentIQ Working Paper CIQ-WP-2026-05, version 1. https://medialabs-co.com/research/category-beauty-and-personal-care
Analysis and data: Coherence Research, Coherence ContentIQ. Published by MediaLabs in collaboration with Coherence Limited.
Version history
- Version 11 Oct 2026This version