ContentIQ working paperCIQ-WP-2026-07CategoryVersion 11 Oct 2026
In Sports & Outdoor, price-led openings and reviews sell above average while demos carry the volume
Our analysis of 631 top-selling Sports & Outdoor videos on TikTok Shop, 174 analysed in depth, 2 September to 1 October 2026
MediaLabs Research · in collaboration with Coherence Limited
Key findings
- 011.36×Sales per view for price-or-deal hooks vs. the market (range 1.02–1.81, 11 videos)
- 021.27×Sales per view for reviews and testimonials (range 1.03–1.56, 29 videos)
- 0333%Share of watched-video sales from relatable POV openings, at average sales per view
- 0435%Share of sales from demos and tutorials, the largest format, selling at 0.92×
- 0576October seasonal index (100 = a normal month), the category's weakest month; March peaks at 138
- 060.64Model AUC for ranking top sellers (range 0.57–0.70)
Contents
Abstract
We examine which openings, formats and production styles are associated with higher sales per view among top-selling Sports & Outdoor videos on TikTok Shop, and what the category's seasonal pattern implies for the months ahead. Price-or-deal hooks sell at 1.36× the market average (90% range 1.02–1.81) and reviews or testimonials at 1.27× (1.03–1.56), while demos and relatable POV openings account for the largest shares of sales at roughly average efficiency. Filmed live action accounts for 96% of watched-video sales. A predictive model ranks top sellers with modest skill (AUC 0.64, range 0.57–0.70), and the seasonal index points to a soft October before a March peak; the 30-day window and small subgroups mean most estimates are uncertain.
1. Introduction
Sellers in Sports & Outdoor face a practical question: when a short shopping video is made, which choices about the opening seconds, the format and the production style are associated with more sales for each view earned? Total sales mostly reflect reach, so we focus on sales per view, a measure of how efficiently attention converts once it arrives.
Prior work on online content shows that attention is long-tailed and that early popularity is a strong predictor of later popularity [1]. Recent short-video popularity research has built multimodal prediction benchmarks [2], and state-of-the-art systems find that creator features matter most [3]. That literature mostly predicts views; less is known about which content choices convert views into purchases within a single retail category.
This working paper reports what our analysis of top-selling TikTok Shop videos shows for Sports & Outdoor over one month, with explicit uncertainty ranges and a seasonal outlook.
2. Data
The sample comprises 631 top-selling Sports & Outdoor videos observed between 2 September and 1 October 2026. Of these, 174 had view counts recorded over the window (watched videos), which is the base for sales-per-view estimates; the market comparison uses 3,340 watched videos across categories.
For each video we recorded the opening hook type, the format, the production style, and the share of watched-video sales it represents. Category-level monthly sales were also recorded to build a seasonal index in which 100 equals a normal month.
The window is short, covering a single month, and several subgroups contain fewer than ten videos. Results should be read as a snapshot of top sellers in this period, not of all Sports & Outdoor content.
Daily rankings of top-selling TikTok Shop videos, products and categories in the US were collected from several independent sources and merged into one record per video. Where sources overlap, their sales estimates are cross-checked against each other, and videos whose estimates disagree by more than half are flagged. An AI analyst watched each video and recorded its opening, format, angle, production style, use of AI and hook source, without seeing how the video sold. Sales per view is a video group's revenue per view divided by the market's, shrunk toward the average for small groups, with 90% ranges. This paper covers 2026-09-02 to 2026-10-01: 631 videos tracked in Sports & Outdoor, 174 of them watched and analysed; the market baseline uses all 3,340 watched videos. Predictions come from a logistic model retrained daily and tested on recent weeks it had not seen.
3. Methods
Our yield index is sales per view for a group of videos divided by the market average, so 1 means the group sells at the market rate. Because small groups produce noisy ratios, each estimate is shrunk toward the market mean using empirical-Bayes shrinkage [4]; groups with few videos are pulled further toward 1. We report 90% intervals and a confidence label (high, medium or low) reflecting group size and interval width.
Separately, we fitted a predictive model that scores whether a video becomes a top seller from its content features and their interactions, trained on 2,667 rows across the market. Performance is evaluated with a time split, training on earlier videos and testing on later ones, and summarised with AUC, the probability that a randomly chosen top seller is ranked above a randomly chosen non-top seller [5]. The 90% range for AUC comes from bootstrap resampling [6].
The model was not restricted to analyses that never saw sales (cleanOnly is false), so some leakage between feature extraction and outcomes cannot be ruled out. Model drivers are reported as odds ratios and describe associations, not effects.
4. Results: Openings
Price-or-deal hooks show the highest sales per view, at 1.36× the market (90% range 1.02–1.81), though they come from only 11 videos and carry medium confidence. Bold claims sell at 1.11× (0.89–1.37) and account for 17% of sales; visual pattern-breaks sit near average at 1.02× (0.77–1.34) with 16% of sales.
Relatable POV openings are the volume leader, with 33% of watched-video sales across 48 videos, and sell exactly at the market rate (1.00×, range 0.84–1.19, high confidence). Problem call-outs (0.93×), questions (0.89×) and result-first openings (0.91×) all have intervals spanning 1.
Trend-or-sound hooks show the lowest point estimate at 0.79× (0.57–1.09), but on just 6 videos with low confidence. Apart from price-or-deal, no hook's interval excludes the market average.
| Value | Videos (n) | Share of sales | Sales per view | 90% range |
|---|---|---|---|---|
| Price or deal | 11 | 5.3% | 1.36× | 1.02–1.81 |
| Straight into the demo | 6 | 2.9% | 1.17× | 0.84–1.62 |
| Bold claim | 28 | 16.9% | 1.11× | 0.89–1.37 |
| Visual pattern-break | 21 | 15.9% | 1.02× | 0.77–1.33 |
| Relatable POV | 48 | 33% | 1.00× | 0.84–1.19 |
| Problem call-out | 18 | 10.2% | 0.93× | 0.72–1.19 |
| Result first | 7 | 4% | 0.91× | 0.66–1.25 |
| Question | 11 | 5.9% | 0.89× | 0.60–1.31 |
| Comparison | 5 | 2.6% | 0.86× | 0.59–1.25 |
| Trend or sound | 6 | 3.4% | 0.79× | 0.57–1.09 |
Note. Sales per view is relative to the market (1.00 = average), shrunk toward the average for small groups (empirical Bayes); ranges are 90% intervals on the log scale.
5. Results: Formats and production
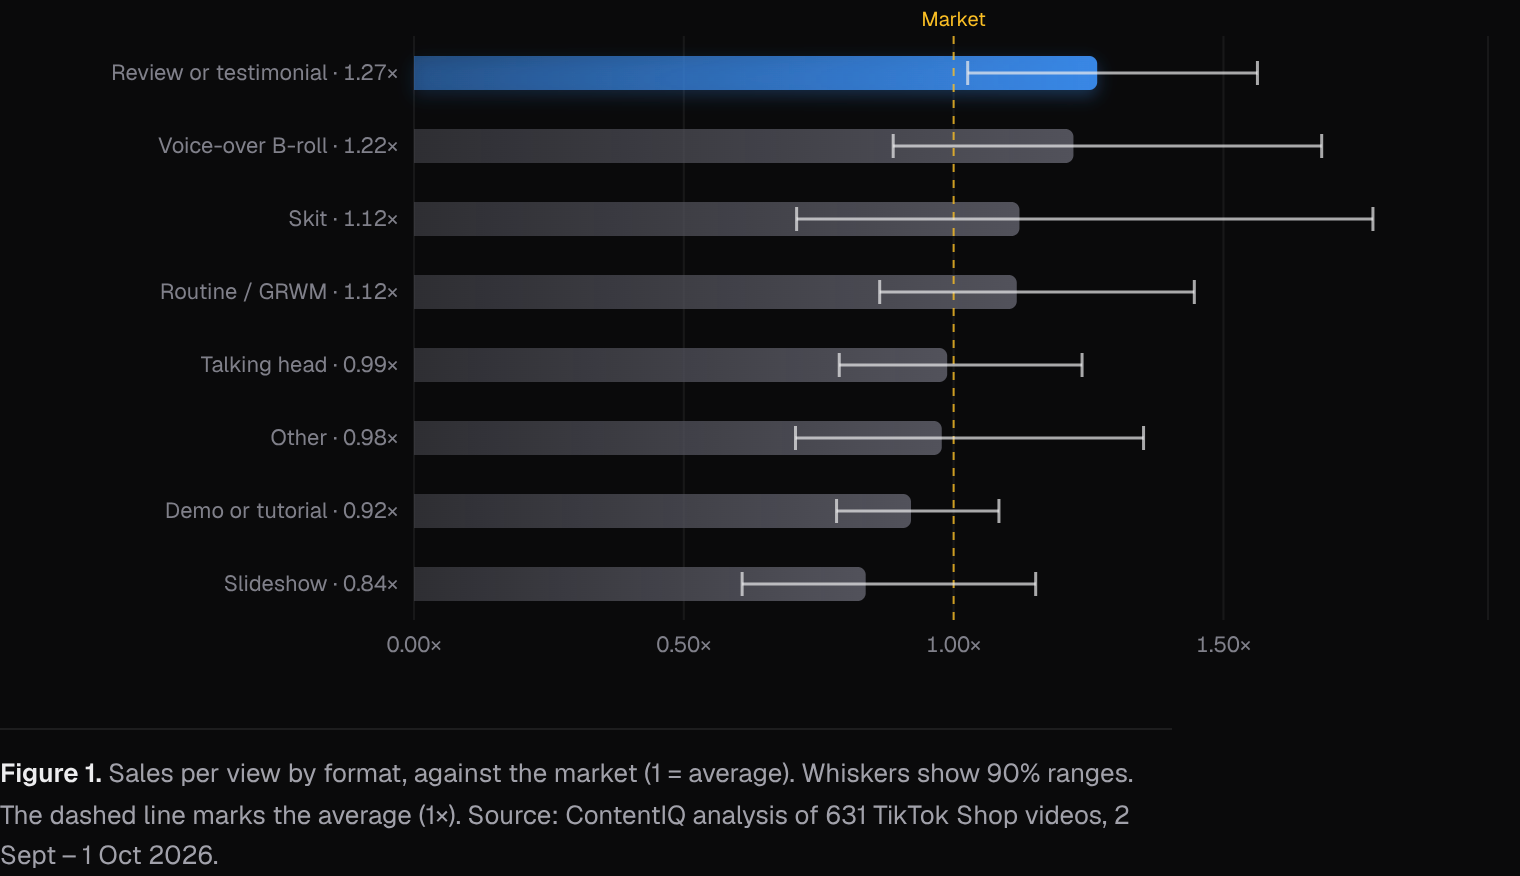
Reviews and testimonials sell at 1.27× the market (90% range 1.03–1.56) across 29 videos and 17% of sales, the only format whose interval sits above 1. Voice-over B-roll (1.22×, 0.89–1.68) and skits (1.12×, 0.71–1.78) have higher point estimates than most formats but rest on 7 and 9 videos respectively.
Demos and tutorials are the dominant format, with 58 videos and 35% of sales, yet sell slightly below average at 0.92× (0.78–1.08, high confidence). Talking heads sit at 0.99× and routines at 1.12×, both with intervals spanning 1. Slideshows show 0.84× (0.61–1.15) on 7 videos.
Production is concentrated: filmed live action accounts for 96% of watched-video sales across 128 videos and sells at 1.02× (0.92–1.15). Photo slideshows, at 6 videos, sell at 0.80× (0.57–1.11). In the market-wide model, filmed live action is the strongest positive driver (odds ratio 2.54), with no visible AI (1.71), before-and-after content (1.66) and ad boosting (1.59) also positive, while education (0.59) and showing the product in the first second (0.62) are associated with lower odds. The model ranks top sellers with modest skill: AUC 0.641 (90% range 0.573–0.696), trained without the cleanOnly restriction.
6. Results: The season ahead
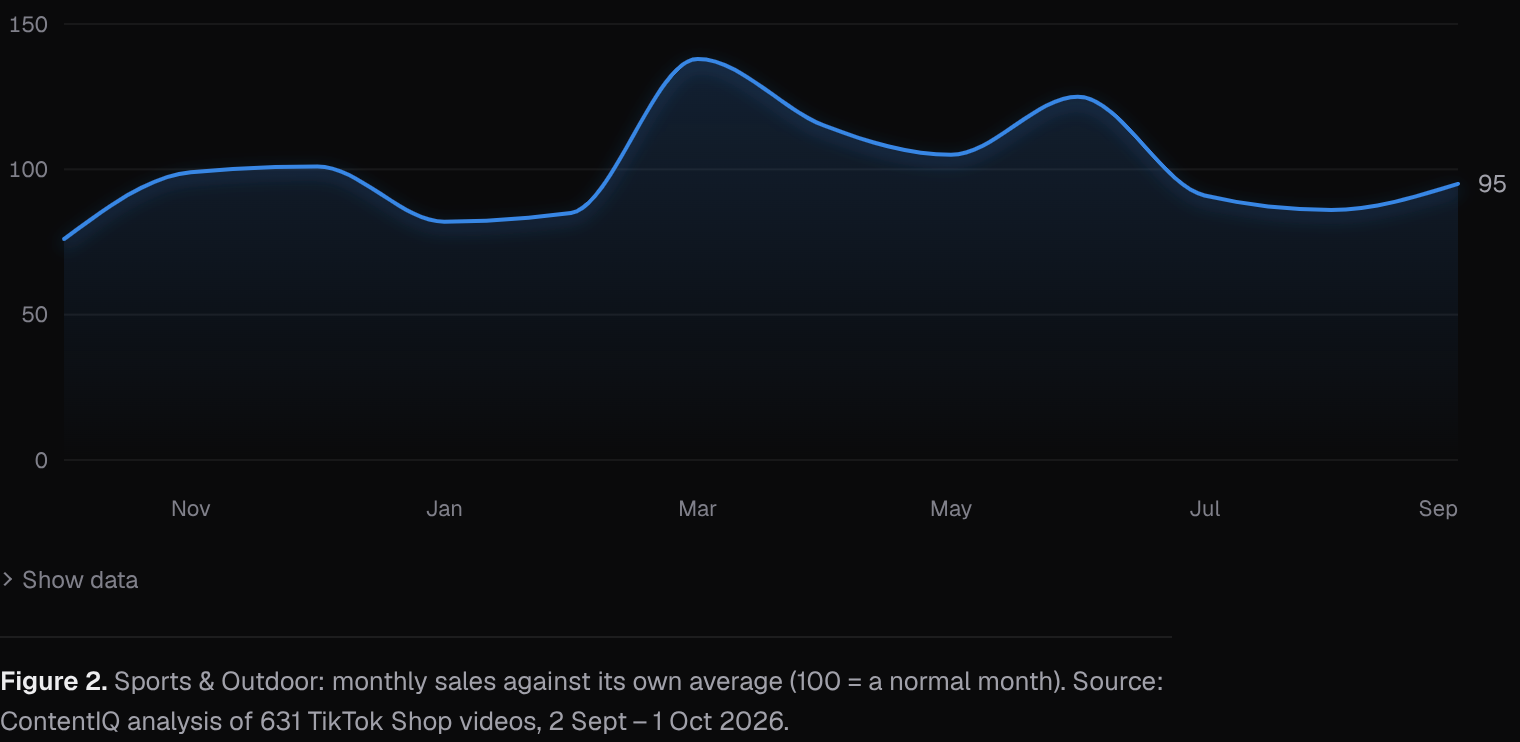
The category's seasonal index shows October as its weakest month at 76, against 100 for a normal month. November (99) and December (101) return to roughly normal levels, followed by a dip in January (82) and February (85).
The strongest period is spring and early summer: March peaks at 138, with April at 115, May at 105 and June at 125. July (91), August (86) and September (95) run below average.
These indices describe past monthly patterns for the category and are not a forecast of any individual seller's results.
7. Discussion
For creators and brands, the pattern suggests a split between volume and efficiency. Demos and relatable POV openings carry the largest shares of sales but convert at about the market rate, while price-or-deal hooks and reviews are associated with higher sales per view. Pairing a deal-led or testimonial approach with the familiar demo structure is one reasonable test, and the model's positive interaction between visual pattern-breaks and reviews (odds ratio 1.92) points in the same direction. With October seasonally soft, efficiency per view may matter more than usual in the coming weeks, ahead of the March peak.
These findings sit alongside, not against, prior work. Popularity research stresses early attention [1] and creator features [3]; we do not measure creator characteristics, so format and hook differences may partly reflect who uses them. Price-or-deal hooks may also coincide with promotions or lower price points that raise conversion independent of the opening itself.
Other explanations remain open. The sample is restricted to top sellers, so these are differences among successful videos, not between success and failure. Ad boosting appears as a model driver, and paid distribution could shape both views and sales. The model's AUC of 0.64 indicates useful but limited ranking ability, and the absence of the cleanOnly restriction means its drivers should be treated as provisional.
8. Conclusion
Among top-selling Sports & Outdoor videos over one month, price-or-deal hooks (1.36×) and reviews or testimonials (1.27×) are the only groups whose 90% intervals sit above the market average, while demos and relatable POV openings account for most sales at roughly average efficiency. Filmed live action dominates production.
The season ahead starts weak in October, normalises in November and December, and peaks in March. Given the short window, small subgroups and a modest model, these results are best used to prioritise tests rather than to settle strategy; later versions with more data will tighten the ranges.
Methodology
Daily rankings of top-selling TikTok Shop videos, products and categories in the US were collected from several independent sources and merged into one record per video. Where sources overlap, their sales estimates are cross-checked against each other, and videos whose estimates disagree by more than half are flagged. An AI analyst watched each video and recorded its opening, format, angle, production style, use of AI and hook source, without seeing how the video sold. Sales per view is a video group's revenue per view divided by the market's, shrunk toward the average for small groups, with 90% ranges. This paper covers 2026-09-02 to 2026-10-01: 631 videos tracked in Sports & Outdoor, 174 of them watched and analysed; the market baseline uses all 3,340 watched videos. Predictions come from a logistic model retrained daily and tested on recent weeks it had not seen.
Limitations
Most videos in the sample are top-ranked, so findings mostly separate strong sellers from good ones rather than from all videos; typical and weak videos are being added. Results are associations, not causes. Paid promotion, creator audience size and product price are not fully controlled for. Revenue and views are estimates, not figures reported by TikTok. The window covers only 30 days, and sales-per-view estimates rest on 174 watched videos; several hook and format groups have 5 to 9 videos and low confidence. The sample contains only top sellers, so it cannot compare winning and non-winning content. The predictive model was trained market-wide, includes drivers from other categories, and was not limited to analyses that never saw sales, so leakage cannot be excluded. Creator characteristics, pricing and promotion depth were not controlled for. All results are associations.
References
- [1]Szabo, G., & Huberman, B. A. (2010). Predicting the popularity of online content. Communications of the ACM, 53(8), 80–88. cacm.acm.org/research/predicting-the-popularity-of-online-content
- [2]Lu, J., Wang, W., Xiao, M., et al. (2024). M3TR: Temporal retrieval enhanced multi-modal micro-video popularity prediction. arXiv:2411.15455. arxiv.org/abs/2411.15455
- [3]Ye, L., Zhang, Y., Wu, Y., et al. (2025). MVP: Winning solution to SMP Challenge 2025 video track. arXiv:2507.00950. arxiv.org/abs/2507.00950
- [4]Efron, B., & Morris, C. (1975). Data analysis using Stein’s estimator and its generalizations. Journal of the American Statistical Association, 70(350), 311–319.
- [5]Fawcett, T. (2006). An introduction to ROC analysis. Pattern Recognition Letters, 27(8), 861–874.
- [6]Efron, B., & Tibshirani, R. J. (1993). An Introduction to the Bootstrap. Chapman & Hall.
Cite as
MediaLabs Research, in collaboration with Coherence Limited (2026). In Sports & Outdoor, price-led openings and reviews sell above average while demos carry the volume. ContentIQ Working Paper CIQ-WP-2026-07, version 1. https://medialabs-co.com/research/category-sports-and-outdoor
Analysis and data: Coherence Research, Coherence ContentIQ. Published by MediaLabs in collaboration with Coherence Limited.
Version history
- Version 11 Oct 2026This version