ContentIQ working paperCIQ-WP-2026-43FoundersVersion 12 Oct 2026
Top 10 sellers do not pay affiliates more: median commission is 9% and 20% list none
2,800 top-selling products across 29 categories, 3 Sept–2 Oct 2026
MediaLabs Research · in collaboration with Coherence Limited
Key findings
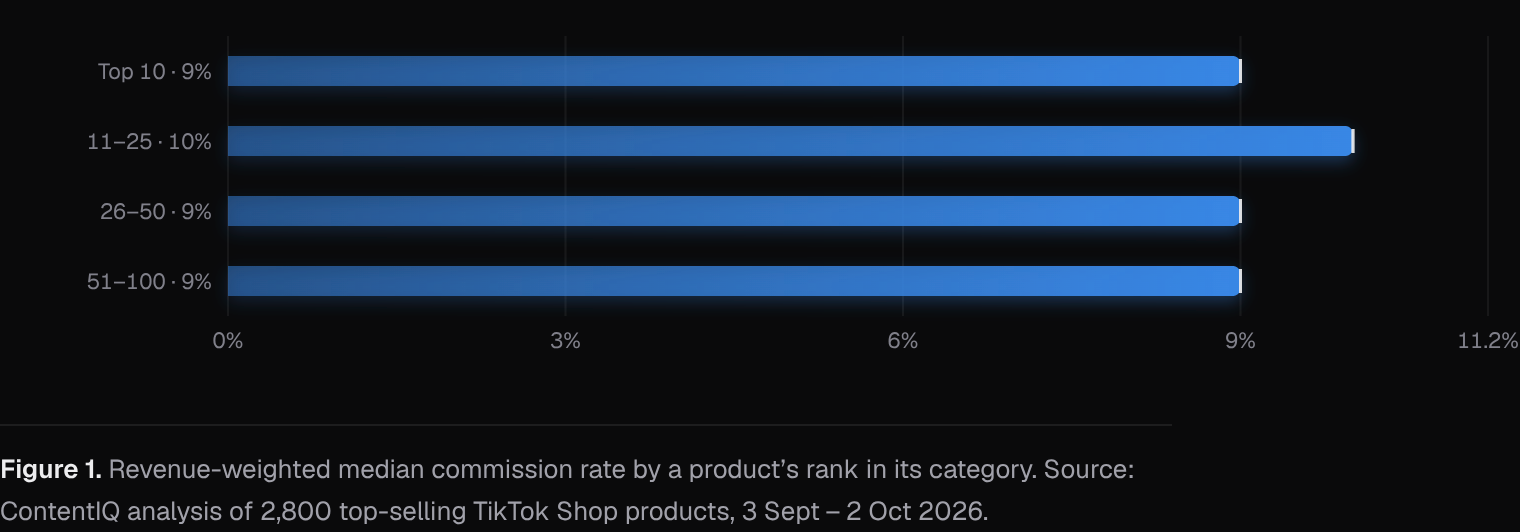
- 019%revenue-weighted median commission of top-10 products, against 10%, 9% and 9% for ranks 11–25, 26–50 and 51–100
- 0220%of top-10 products list 0% commission (18%–25% in the other rank bands)
- 0312 vs 9categories where the top 10 pay more than the rest, against those where they pay less (28 compared)
- 0431%of tracked revenue comes from the top 10 in each category, which is 10% of the 2,800 products
- 05$43revenue-weighted median price of top-10 products, against $38–$39 in lower ranks
Contents
Abstract
We compared affiliate commission for the top 10 sellers in each TikTok Shop category against products ranked 11–100. The revenue-weighted median listed commission was 9% for the top 10, against 10%, 9% and 9% for the lower rank bands, and 20% of top-10 products listed no commission at all. The top 10 paid more than the rest in 12 of 28 categories compared and less in 9. Price and video share of revenue varied only modestly by rank. Commission looks like a category norm more than a feature of the best sellers.
1. Introduction
Brands choosing what to offer affiliates on TikTok Shop face a practical question: do the products that already sell best pay more to the creators who promote them, or less? A high rate might be what buys a top rank, or leaders might be able to pay less because they already sell. Prior work on affiliate programmes shows that referral fees are set by trading off the seller's margin against the incentive to refer, and that they vary across sellers and products [1]. It does not tell a founder what the going rate is among the products winning today.
This paper describes the commission that top-selling products list, how many list none, and how commission lines up with price and with the share of revenue that comes through video. It is descriptive. It cannot say whether commission causes sales or the reverse.
2. Data
The sample covers 2,800 top-selling products across 29 categories, with the latest-week rankings taken as of 2 October 2026 within a window running from 3 September to 2 October 2026. Each category contributes its tracked top 100 sellers by revenue, grouped into four rank bands: top 10 (280 products), 11–25 (420), 26–50 (700) and 51–100 (1,400).
For each product we recorded its listed affiliate commission rate, price, revenue and the share of its revenue that came through video. No individual videos are analysed in this paper. The category comparison covers 28 categories, because one of the 29 could not be compared.
Weekly category figures for the US (estimated revenue, its split between video, LIVE and the shop tab, affiliate revenue, shops and active products, and a year of weekly revenue) and daily rankings of each category’s top-selling products (unit price, commission rate, launch date and revenue by channel) were collected from several independent sources. Medians of price and commission are weighted by revenue; momentum compares the latest weeks with the same number of weeks before. This paper covers 2026-09-03 to 2026-10-02: 2,800 top-selling products across 29 categories.
3. Methods
Products were ranked by revenue within each category among its tracked top sellers in the latest week. For each rank band, and for each category's top 10 against ranks 11–100, we computed the revenue-weighted median commission rate: the rate at which half of the revenue sits on products with lower listed rates and half on higher. Products listed at 0% commission were left out of these medians and reported separately as the share of products listed at zero. Commission rates on offer are known to vary with how sellers trade off margin and referral volume [1].
We report the same revenue-weighted median for price, and the share of revenue that came through video by band. Uncertainty ranges are not available for these figures, so differences of a point or two between bands should not be read as meaningful.
4. Results: commission by rank in category
The revenue-weighted median commission was 9% for the top 10 products in each category, 10% for ranks 11–25, 9% for ranks 26–50 and 9% for ranks 51–100. There is no sign that the best sellers pay a clearly higher rate. The highest band is the one just below the top 10, and the gap is one point.
The top 10 account for 30.7% of revenue among the 2,800 products while making up 10% of them. Ranks 11–25 account for 20%, ranks 26–50 for 21.3% and ranks 51–100 for 28%, so revenue is concentrated at the top but a substantial share sits in the long tail [2].
5. Results: zero commission, price and video share
Listing no commission is common at every rank. The share of products listed at 0% was 20.4% in the top 10, 18.3% in ranks 11–25, 24.7% in ranks 26–50 and 22.8% in ranks 51–100. About one in five top sellers therefore offers affiliates nothing through this listing, and these are excluded from the medians above.
The revenue-weighted median price was $43 for the top 10, $39 for ranks 11–25 and $38 for the two lower bands. The share of revenue that came through video was 78.8% for the top 10 against 75.2%, 76.9% and 78.3% in the lower bands. Top sellers sit at slightly higher prices and slightly higher video share, but the commission did not rise with either across the bands.
| Rank in category | Products (n) | Share of revenue | Median commission | Listed at 0% | Median price | Sold through video |
|---|---|---|---|---|---|---|
| Top 10 | 280 | 30.7% | 9% | 20.4% | $43.00 | 78.8% |
| 11–25 | 420 | 20% | 10% | 18.3% | $39.00 | 75.2% |
| 26–50 | 700 | 21.3% | 9% | 24.7% | $38.00 | 76.9% |
| 51–100 | 1,400 | 28% | 9% | 22.8% | $38.00 | 78.3% |
Note. Ranks are by revenue among each category’s tracked top-selling products in the latest week. Medians are weighted by revenue; the commission median leaves out products listed at 0%.
6. Results: top 10 against the rest, by category
Of 28 categories compared, the top 10 had a higher median commission than ranks 11–100 in 12 and a lower one in 9; the remaining 7 were level. Differences were large in some categories: Furniture 9% against 6%, Fashion Accessories 6% against 3%, and Home Supplies 11% against 9% at the top; Automotive & Motorcycle 6% against 10%, Computers & Office Equipment 5% against 8%, and Tools & Hardware 4% against 6% in the other direction.
Levels differ far more between categories than between ranks. Health had a top-10 median of 20% (rest 19%), Books, Magazines & Audio 14% (rest 12%), and Beauty & Personal Care 13% (rest 14%), while Collectibles had 2% (rest 3%) and Household Appliances 5% (rest 5%). Zero listings among the top 10 ranged from 0% in categories such as Health, Shoes and Food & Beverages to 90% in Collectibles, 40% in Fashion Accessories and 30% in Household Appliances, Phones & Electronics, Home Supplies and Jewelry Accessories & Derivatives. Where most top-10 products list zero, the median rests on very few products.
| Category | Top 10 median | Ranks 11–100 median | Top 10 listed at 0% |
|---|---|---|---|
| Beauty & Personal Care | 13% | 14% | 10% |
| Womenswear & Underwear | 9% | 8% | 10% |
| Sports & Outdoor | 7% | 8% | 0% |
| Health | 20% | 19% | 0% |
| Household Appliances | 5% | 5% | 30% |
| Phones & Electronics | 8% | 8% | 30% |
| Shoes | 10% | 9% | 0% |
| Textiles & Soft Furnishings | 11% | 10% | 20% |
| Furniture | 9% | 6% | 10% |
| Home Supplies | 11% | 9% | 30% |
| Menswear & Underwear | 8% | 9% | 10% |
| Home Improvement | 7% | 7% | 10% |
| Tools & Hardware | 4% | 6% | 0% |
| Fashion Accessories | 6% | 3% | 40% |
| Automotive & Motorcycle | 6% | 10% | 20% |
Note. Revenue-weighted median commission rates, leaving out products listed at 0%.
7. Discussion
For a founder, the main message is that the category sets the commission norm and rank adds little. Top sellers in Health list around 20%, while top sellers in Collectibles mostly list nothing. Matching your category's median looks more useful than matching the overall 9%.
Several explanations fit these patterns. Established leaders may have enough organic demand or brand pull to pay less, or may rely on other routes such as their own shop or LIVE selling [3]. Low-margin categories may simply not afford higher rates, consistent with the view that fees reflect margins [1]. Products at 0% may rely on other arrangements, and a listed rate is not the amount actually paid. Because commission and rank are observed together, we cannot say whether higher rates help sales; returns to promotion are hard to establish from observational data [4].
8. What this means for brands and founders
- Benchmark against your category, not the overall market: top-10 median commission ran from 2% in Collectibles to 20% in Health, against 9% across all top-10 products.
- Do not assume a higher rate buys a top rank: the top 10 listed a median of 9% against 10% for ranks 11–25, and paid more than the rest in only 12 of 28 categories.
- Check whether zero commission is normal where you sell: 20% of top-10 products list 0%, and 90% do in Collectibles, though in Health, Shoes and Food & Beverages none did.
- Price in line with the leaders when planning your margin: the top 10 had a revenue-weighted median price of $43 against $38–$39 lower down, and 79% of their revenue came through video.
9. Conclusion
Among the top-selling products in 29 TikTok Shop categories, the top 10 in each category list a revenue-weighted median commission of 9%, close to the 9%–10% of lower ranks, and 20% of them list none. Category, not rank, is the clearer guide to what to offer.
These are listed rates for a single latest-week ranking, with no uncertainty ranges, so small differences should be treated cautiously. We cannot tell whether commission drives sales.
Methodology
Weekly category figures for the US (estimated revenue, its split between video, LIVE and the shop tab, affiliate revenue, shops and active products, and a year of weekly revenue) and daily rankings of each category’s top-selling products (unit price, commission rate, launch date and revenue by channel) were collected from several independent sources. Medians of price and commission are weighted by revenue; momentum compares the latest weeks with the same number of weeks before. This paper covers 2026-09-03 to 2026-10-02: 2,800 top-selling products across 29 categories.
Limitations
Product figures cover the top-selling products we track in each category, not every listing, so they describe what sells best rather than everything on sale. Results are associations, not causes. Paid promotion, creator audience size and product price are not fully controlled for. Revenue, views and sales are estimates, not figures reported by TikTok. Rates are those listed, not necessarily what was paid, and a 0% listing may reflect other arrangements. Rankings use one latest week within a 30-day window. Medians exclude 0% products, so categories with many zero listings rest on few products, and no uncertainty ranges are available. Only each category's tracked top 100 sellers are covered, so the results say nothing about smaller products. Of 29 categories, 28 were compared.
References
- [1]Libai, B., Biyalogorsky, E., & Gerstner, E. (2003). Setting referral fees in affiliate marketing. Journal of Service Research, 5(4), 303–315.
- [2]Brynjolfsson, E., Hu, Y. J., & Smith, M. D. (2003). Consumer surplus in the digital economy: Estimating the value of increased product variety at online booksellers. Management Science, 49(11), 1580–1596.
- [3]Wongkitrungrueng, A., & Assarut, N. (2020). The role of live streaming in building consumer trust and engagement with social commerce sellers. Journal of Business Research, 117, 543–556.
- [4]Lewis, R. A., & Rao, J. M. (2015). The unfavorable economics of measuring the returns to advertising. The Quarterly Journal of Economics, 130(4), 1941–1973.
Cite as
MediaLabs Research, in collaboration with Coherence Limited (2026). Top 10 sellers do not pay affiliates more: median commission is 9% and 20% list none. ContentIQ Working Paper CIQ-WP-2026-43, version 1. https://medialabs-co.com/research/founders-commission-strategy
Analysis and data: Coherence Research, Coherence ContentIQ. Published by MediaLabs in collaboration with Coherence Limited.
Version history
- Version 12 Oct 2026This version