ContentIQ working paperCIQ-WP-2026-44FoundersVersion 12 Oct 2026
Products launched in the last 90 days earned 17.4% of TikTok Shop top-seller revenue, at 0.84× the average per product
2,800 top-selling products across 29 categories, 3 Sept–2 Oct 2026
MediaLabs Research · in collaboration with Coherence Limited
Key findings
- 0117.4%of top-seller revenue came from products launched in the last 90 days
- 020.84×revenue per new product against the average product (1.1× for products over a year old)
- 0355.3%of Collectibles top-product revenue came from new products, against 3.8% in Health
- 04$60 vs $36revenue-weighted median price of new products against products over a year old
- 0549.7%of new products were listed at zero commission, against 12.1% of those over a year old
- 0625.6%of new-product revenue came through LIVE, against 16.1% for the oldest products
Contents
Abstract
We compared products launched in the last 90 days with older products among the tracked top sellers on TikTok Shop. New products earned 17.4% of top-seller revenue and held 59 top-10 places, but each earned 0.84× the revenue of the average product, below the 1.1× of products launched over a year ago. Their share varies widely by category, from 3.8% in Health to 55.3% in Collectibles. New products sold at a higher revenue-weighted median price ($60 against $36 for the oldest group), were more often listed at zero commission (49.7% against 12.1%) and drew more of their revenue from LIVE (25.6% against 16.1%). These are descriptive associations from one week of data.
1. Introduction
Brand owners and founders on TikTok Shop face a basic question: is the top-seller list a place where new products can break in, or is it held by established ones? The answer affects what to launch, in which category, and how much to expect from a launch in its first 90 days. Creators who choose which products to feature face the same question.
Prior work on online retail shows that sales extend well beyond a few bestsellers into a long tail of varied products [1]. On TikTok Shop, sales also depend on the channel. Research on live-stream selling links it to trust and engagement with social commerce sellers [2], and research on affiliate marketing treats referral fees (commissions) as a lever that sellers set and vary [3].
This paper asks four things. How much top-seller revenue and how many top-10 places go to products launched in the last 90 days? How does that differ by category? How do these breakout products differ from older ones on price, commission and sales channel? And how reliable are the answers given the data?
2. Data
The data cover the tracked top-selling products on TikTok Shop in the window 3 September to 2 October 2026: 2,800 products across 29 categories. Products are grouped by launch date into three groups: launched in the last 90 days (583 products), launched 90 days to a year ago (1,064) and launched over a year ago (1,153).
For each product we recorded revenue, price, commission rate, and the share of revenue coming through video and through LIVE. Within each category we also recorded the top-10 places and which of them went to new products. No video-level analysis is used in this paper.
The category breakdown shows 24 categories, each with 100 tracked products. Category figures are therefore based on 100 products each, and the new-product count behind each is small, from 5 to 59 products.
Weekly category figures for the US (estimated revenue, its split between video, LIVE and the shop tab, affiliate revenue, shops and active products, and a year of weekly revenue) and daily rankings of each category’s top-selling products (unit price, commission rate, launch date and revenue by channel) were collected from several independent sources. Medians of price and commission are weighted by revenue; momentum compares the latest weeks with the same number of weeks before. This paper covers 2026-09-03 to 2026-10-02: 2,800 top-selling products across 29 categories.
3. Methods
We compared products launched in the last 90 days with older ones among each category’s tracked top sellers in the latest week. For each launch-age group we computed the share of revenue, revenue per product relative to the average product (1 = average), the number of top-10 places held, and the revenue-weighted median price and commission. This follows the long-tail view of online sales in which many products, not just the bestsellers, matter [1].
For each category we computed the share of top-product revenue from new products and the share of the category’s top 10 products that are new. Because a top 10 has ten places, the second measure moves in steps of 10 percentage points.
We also report the share of each group listed at zero commission, and the shares of revenue from video and from LIVE. No confidence ranges were computed for these statistics, so differences between groups are descriptive and should not be read as statistically tested.
4. Results: new products against established ones
Products launched in the last 90 days earned 17.4% of top-seller revenue and held 59 top-10 places. Products launched 90 days to a year ago earned 37.3% and held 107 places. Products launched over a year ago earned 45.3% and held 114 places. Revenue per product rises with age: 0.84× the average for the newest group, 0.98× for the middle group and 1.1× for the oldest.
New products look different on price and commission. Their revenue-weighted median price was $60, against $39 and $36 for the older groups. Revenue-weighted median commission was similar across groups (9%, 10% and 9%), yet 49.7% of new products were listed at zero commission, against 18.4% and 12.1%.
Channel mix also differs. Video accounted for 64.8% of new-product revenue, against 79% and 81.2% for the older groups. LIVE accounted for 25.6%, against 17% and 16.1%.
| Launched | Products (n) | Share of revenue | Revenue per product vs average | Median price | Median commission | Sold on LIVE | Top-10 slots |
|---|---|---|---|---|---|---|---|
| in the last 90 days | 583 | 17.4% | 0.84× | $60.00 | 9% | 25.6% | 59 |
| 90 days to a year ago | 1,064 | 37.3% | 0.98× | $39.00 | 10% | 17% | 107 |
| over a year ago | 1,153 | 45.3% | 1.10× | $36.00 | 9% | 16.1% | 114 |
Note. Among each category’s tracked top-selling products in the latest week. Medians are weighted by revenue; the commission median leaves out products listed at 0%. Top-10 slots counts places in categories’ top tens by revenue.
5. Results: where new products take the most revenue
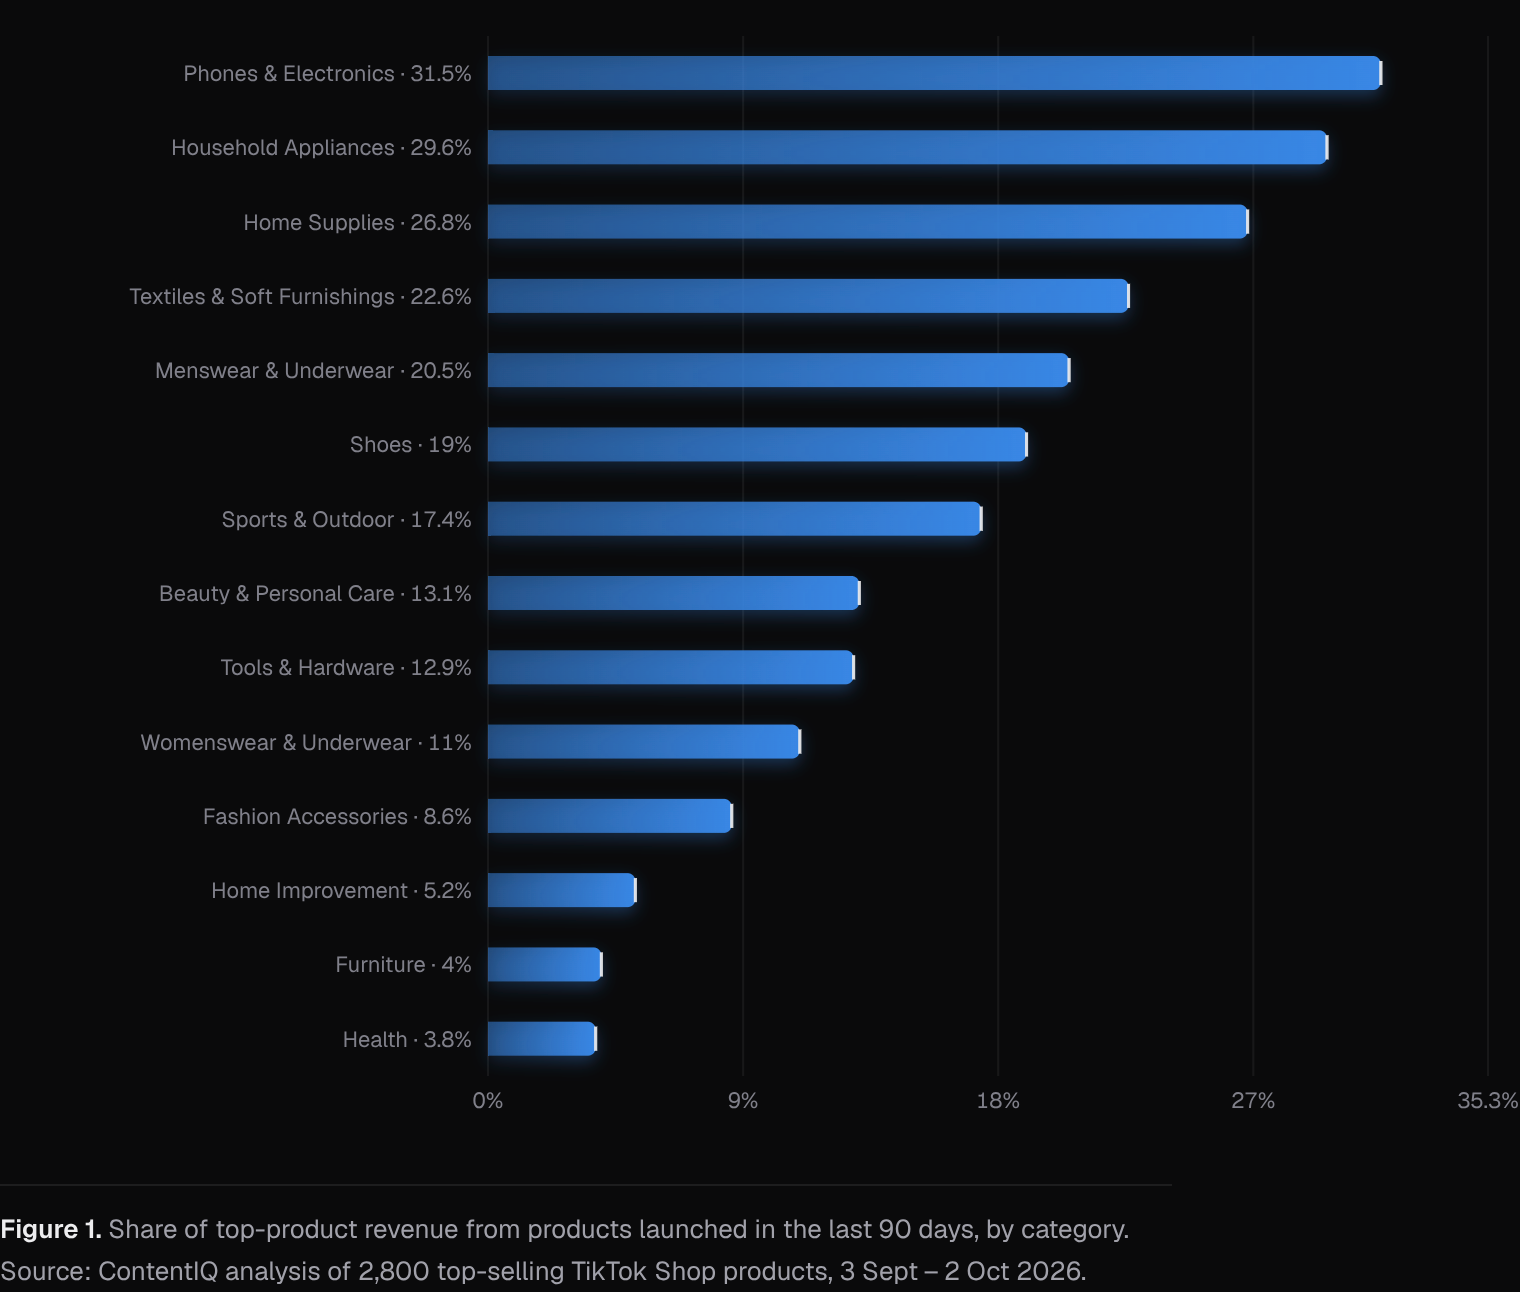
The new-product share of revenue varies widely by category. It is highest in Collectibles (55.3%), Toys & Hobbies (36.8%), Phones & Electronics (31.5%), Household Appliances (29.6%) and Home Supplies (26.8%). It is lowest in Health (3.8%), Furniture (4%), Home Improvement (5.2%), Baby & Maternity (6.2%) and Pet Supplies (7.7%).
The number of new products matters but does not fully explain the share. Collectibles has 59 new products among its 100 tracked. Household Appliances has 15 new products yet 29.6% of revenue, and Beauty & Personal Care has 14 and 13.1%. This suggests that in some categories a few new products take a large share of sales.
Each category rests on 100 tracked products, so small differences between neighbouring categories should not be over-read.
6. Results: new products in the top 10
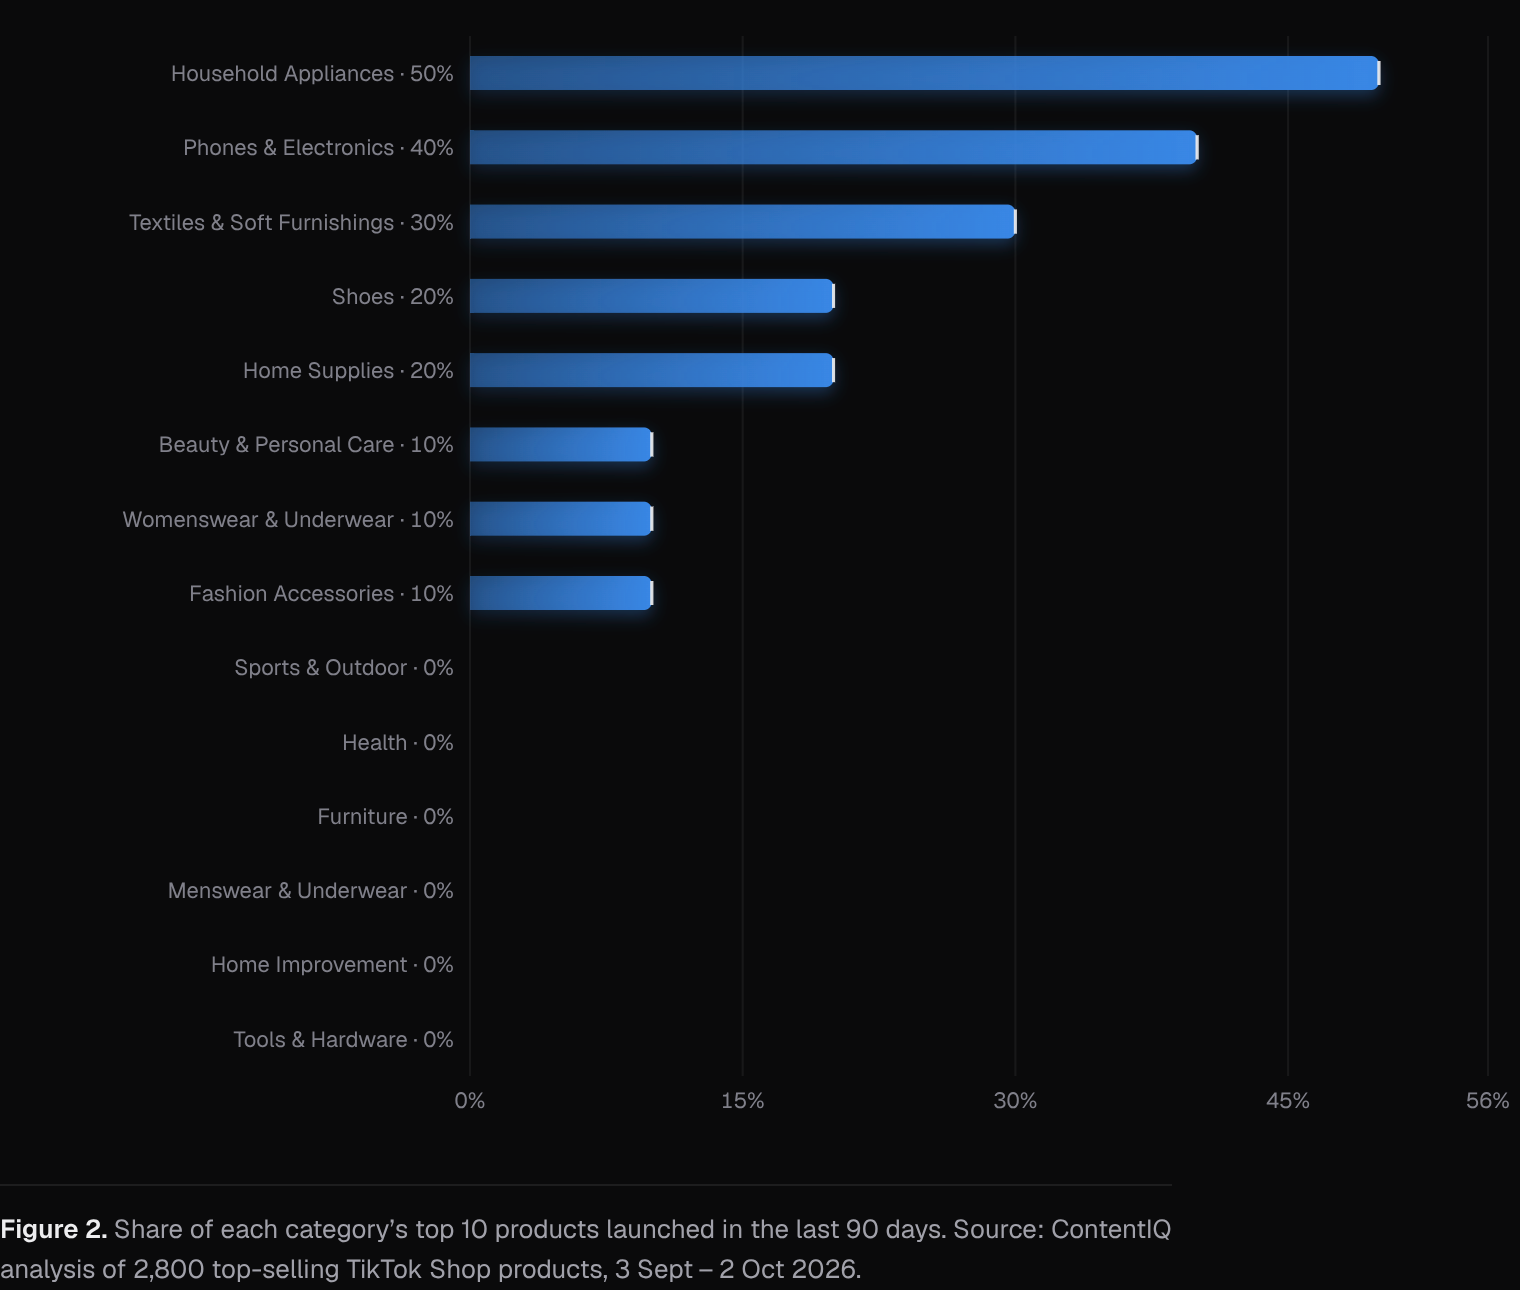
The top 10 is harder to enter than the wider top-seller list. Household Appliances and Collectibles each had 50% of their top 10 places held by new products. Phones & Electronics, Food & Beverages and Toys & Hobbies had 40%, and Textiles & Soft Furnishings had 30%.
Six categories had no new product in the top 10: Sports & Outdoor, Health, Furniture, Menswear & Underwear, Home Improvement, and Tools & Hardware. In two of these, new products still earned a meaningful share of revenue: 17.4% in Sports & Outdoor and 20.5% in Menswear & Underwear. New products there appear to sell below the very top.
Because a top 10 has only ten places and we observe one week, these shares move in steps of 10 points and could change quickly.
7. Discussion
For brands, the evidence points to two different situations. In categories such as Collectibles, Toys & Hobbies, Phones & Electronics and Household Appliances, new products take a large share of revenue and of the top 10. In Health, Furniture and Home Improvement, the top sellers are mostly established products. A new launch in the first group is competing in a market that turns over; in the second it is entering a market dominated by older products.
At the overall level, new products are broad rather than deep: they hold 17.4% of revenue but each earns 0.84× the average product. The long tail described in prior work [1] is consistent with this, though our data cannot test it. For creators, the numbers suggest that featuring newly launched products is common in the top sellers, but that such products individually earn less than established ones on average.
The higher prices, zero-commission listings and LIVE share of new products are associations, not causes. LIVE selling is linked in prior work to trust and engagement [2], which may matter more for unfamiliar products, and commissions are a lever sellers set deliberately [3]. But category mix is an alternative explanation: if new products cluster in higher-priced categories, the price gap may reflect category rather than launch age. A product’s launch date may also not reflect when a brand first sold a similar item. Zero commission may reflect launch offers or seller-run listings, which we cannot separate. Finally, observational sales data cannot show whether promotion or channel choice caused a product to break through [4].
8. What this means for brands and founders
- Pick the category before the product: new products took 55.3% of top-product revenue in Collectibles and 36.8% in Toys & Hobbies, but only 3.8% in Health and 4% in Furniture.
- Set launch expectations against the average: products launched in the last 90 days earned 0.84× the revenue of the average top-seller product, against 1.1× for products over a year old.
- Plan for LIVE alongside video: 25.6% of new-product revenue came through LIVE, against 16.1% for products over a year old.
- Test commission and price together: 49.7% of new products were listed at zero commission, and their revenue-weighted median price was $60 against $36 for the oldest products.
- Do not count on a top-10 place early: in six categories, including Health and Tools & Hardware, no new product held a top-10 place.
9. Conclusion
Products launched in the last 90 days are a visible but minority part of TikTok Shop’s top sellers: 17.4% of revenue, 59 top-10 places, and 0.84× the average revenue per product. How open the top sellers are to new products depends heavily on category, from 3.8% of revenue in Health to 55.3% in Collectibles.
Breakout products are associated with higher prices, more zero-commission listings and more LIVE revenue than older products. These patterns come from one week of data on 2,800 products, without confidence ranges, and should guide hypotheses to test rather than prove what makes a launch succeed.
Methodology
Weekly category figures for the US (estimated revenue, its split between video, LIVE and the shop tab, affiliate revenue, shops and active products, and a year of weekly revenue) and daily rankings of each category’s top-selling products (unit price, commission rate, launch date and revenue by channel) were collected from several independent sources. Medians of price and commission are weighted by revenue; momentum compares the latest weeks with the same number of weeks before. This paper covers 2026-09-03 to 2026-10-02: 2,800 top-selling products across 29 categories.
Limitations
Product figures cover the top-selling products we track in each category, not every listing, so they describe what sells best rather than everything on sale. Results are associations, not causes. Paid promotion, creator audience size and product price are not fully controlled for. Revenue, views and sales are estimates, not figures reported by TikTok. The figures reflect one latest week of sales within a 30-day window. They cover only tracked top-selling products, not the whole marketplace. The category breakdown lists 24 categories of 100 products each, and the new-product count behind each is small (5 to 59), so category shares are noisy. Top-10 shares move in steps of 10 points. No confidence ranges are available, and launch age is measured from listing date, which may not reflect a brand’s earlier history. Price, commission and channel differences may partly reflect category mix.
References
- [1]Brynjolfsson, E., Hu, Y. J., & Smith, M. D. (2003). Consumer surplus in the digital economy: Estimating the value of increased product variety at online booksellers. Management Science, 49(11), 1580–1596.
- [2]Wongkitrungrueng, A., & Assarut, N. (2020). The role of live streaming in building consumer trust and engagement with social commerce sellers. Journal of Business Research, 117, 543–556.
- [3]Libai, B., Biyalogorsky, E., & Gerstner, E. (2003). Setting referral fees in affiliate marketing. Journal of Service Research, 5(4), 303–315.
- [4]Lewis, R. A., & Rao, J. M. (2015). The unfavorable economics of measuring the returns to advertising. The Quarterly Journal of Economics, 130(4), 1941–1973.
Cite as
MediaLabs Research, in collaboration with Coherence Limited (2026). Products launched in the last 90 days earned 17.4% of TikTok Shop top-seller revenue, at 0.84× the average per product. ContentIQ Working Paper CIQ-WP-2026-44, version 1. https://medialabs-co.com/research/founders-new-product-breakouts
Analysis and data: Coherence Research, Coherence ContentIQ. Published by MediaLabs in collaboration with Coherence Limited.
Version history
- Version 12 Oct 2026This version