ContentIQ working paperCIQ-WP-2026-45FoundersVersion 12 Oct 2026
Shoppable video carries 64.9% of TikTok Shop revenue, and revenue per 1,000 views runs from $9.76 to $31.02 by category
16,541 videos tracked across 29 categories, 3 Sept–2 Oct 2026
MediaLabs Research · in collaboration with Coherence Limited
Key findings
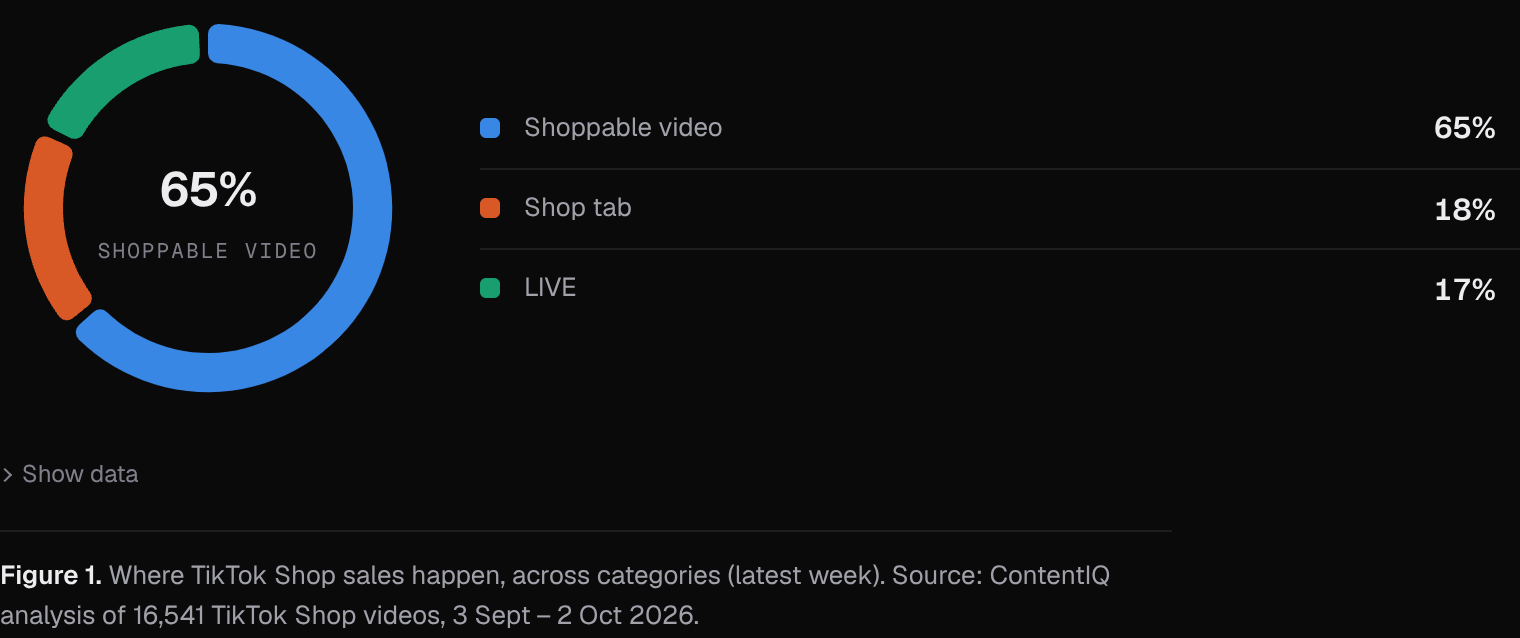
- 0164.9%of TikTok Shop revenue in the latest week came through shoppable video (LIVE 17.1%, shop tab 18%)
- 02$9.76–$31.02revenue per 1,000 views of top-selling videos, from Automotive & Motorcycle to Household Appliances
- 0324.6%–44%share of category revenue taken by the top 10% of video-weeks, from Menswear & Underwear to Toys & Hobbies
- 04$885–$15,064median weekly revenue of a top-selling video, from Jewelry Accessories & Derivatives to Womenswear & Underwear
- 0584.3%of Household Appliances revenue was credited to affiliate creators, against 43% in Jewelry Accessories & Derivatives
Contents
Abstract
We analyse where TikTok Shop revenue is made and what a top-selling video earns, using 16,541 tracked videos in a 30-day window. In the latest week, 64.9% of revenue came through shoppable video, 17.1% through LIVE and 18% through the shop tab. Revenue per 1,000 views of top-selling videos ranged from $9.76 to $31.02 by category, and the top 10% of video-weeks took between 24.6% and 44% of category revenue. These are associations in a sample of top sellers, not estimates of what a typical video or brand will earn.
1. Introduction
Brand owners and founders on TikTok Shop face three linked questions: which categories reward video, how much a winning video earns, and how much of a category's revenue is reachable through video at all rather than LIVE or the shop tab. Creators face the mirror question: where a hit video is worth the most.
Prior work gives some framing. Online attention is long-tailed and early popularity predicts later popularity [1], and online retail sells a long tail of niche products beyond the bestsellers [2]. Live-stream selling has been linked to trust and engagement with social commerce sellers [3], and affiliate commissions are a deliberate design choice that varies by setting [4]. Measuring the returns to promotion from observational data is notoriously hard [5], so we describe patterns and do not estimate effects.
This paper asks what a top-selling video earns in a week, how concentrated revenue is among videos, how revenue per 1,000 views differs by category, and how each category's revenue splits across video, LIVE and the shop tab.
2. Data
The window runs from 3 Sept to 2 Oct 2026 and covers 16,541 tracked videos in 29 categories. The category tables report 25 of those categories. Revenue-by-channel figures describe the latest week, as of 29 Sept 2026. No videos were analysed in depth for this paper, so we make no claims about video content, format or style.
For each category we recorded the number of ranked video-weeks (one row per video and week), the median weekly revenue of a top-selling video, revenue per 1,000 views, the share of category revenue taken by the top 10% of video-weeks, and the share of category revenue through video. For channels we recorded the split into shoppable video, LIVE and the shop tab, plus the share credited to affiliate creators. In every case the remainder labelled other or unattributed was 0%.
The sample consists of top-selling videos, so it describes winners, not all videos. Category sizes differ: Beauty & Personal Care has the most video-weeks (1,599) and Kids' Fashion among the fewest (760), so category estimates are not equally precise. We report no confidence ranges for these descriptive figures.
Weekly figures for the top-selling TikTok Shop videos in the US were collected from commercial data providers: each video’s estimated revenue, views and engagement in each week it ranked, the share of its revenue and views that came from paid promotion (reported per video and top-coded at 80%), its estimated return on ad spend and its publish date. One row is one video in one week (a video-week). Weekly category figures for the US (estimated revenue, its split between video, LIVE and the shop tab, affiliate revenue, shops and active products, and a year of weekly revenue) and daily rankings of each category’s top-selling products (unit price, commission rate, launch date and revenue by channel) were collected from several independent sources. Medians of price and commission are weighted by revenue; momentum compares the latest weeks with the same number of weeks before. This paper covers 2026-09-03 to 2026-10-02: 16,541 videos tracked, 0 of them watched and analysed.
3. Methods
Sales channels: each category's revenue in the latest week was split into shoppable video, LIVE and the shop tab, with any remainder treated as other or unattributed. We also report the share credited to affiliate creators.
Video economics: we took the distribution of top-selling videos' weekly revenue, with one row per video and week ranked, and computed the median weekly revenue and the share of revenue taken by the top 10% of video-weeks in each category, in the spirit of long-tail analyses of attention [1]. Revenue per 1,000 views is total revenue divided by total views, so high-view videos weigh more heavily. Each category's share of revenue through video is taken from its weekly figures.
All figures are descriptive. We fitted no predictive model and report no model metrics.
4. Results: where sales happen
Across categories, shoppable video was the largest channel in the latest week at 64.9% of revenue, ahead of the shop tab at 18% and LIVE at 17.1%. Video's share varied widely by category. It was highest in Baby & Maternity (77.7%), Books, Magazines & Audio (76.3%), Womenswear & Underwear (73.8%) and Shoes (72.5%). Among the other categories it was lowest in Jewelry Accessories & Derivatives (39.4%), Home Improvement (49.7%) and Furniture (56.4%).
LIVE mattered most in Collectibles, at 48.9% of revenue, where video was only 5.8% and the shop tab 45.4%. Collectibles is an outlier, and the evidence does not say why. Among the rest, LIVE was largest in Health (25.1%) and Household Appliances (24.6%) and smallest in Menswear & Underwear (5.7%). The shop tab was largest in Jewelry Accessories & Derivatives (39.8%), Fashion Accessories (29.6%) and Home Improvement (29.3%).
The share credited to affiliate creators tracked the video share. It was 84.3% in Household Appliances, 83.9% in Baby & Maternity and 83.6% in Health, but 43% in Jewelry Accessories & Derivatives, 63.7% in Fashion Accessories and only 7.9% in Collectibles.
5. Results: what a top-selling video earns
The median top-selling video earned between $885 a week in Jewelry Accessories & Derivatives and $15,064 in Womenswear & Underwear, about 17 times as much. Beauty & Personal Care ($9,003), Household Appliances ($7,560), Menswear & Underwear ($7,178) and Sports & Outdoor ($7,150) followed Womenswear. Baby & Maternity ($1,312), Kids' Fashion ($1,435), Kitchenware ($1,710) and Luggage & Bags ($1,741) were near the bottom.
Revenue was concentrated among video-weeks everywhere, but unevenly. The top 10% of video-weeks took 44% of revenue in Toys & Hobbies, 40.8% in Household Appliances, 39.3% in Kitchenware and 39.2% in Home Improvement. They took only 24.6% in Menswear & Underwear and 24.8% in Womenswear & Underwear, where earnings were spread more evenly.
A high median does not imply a flatter or safer category. Beauty & Personal Care had a high median ($9,003) and a top-10% share of 36%, so both a strong typical video and a heavy top end can occur together. These are medians of top-selling video-weeks, not of all videos.
| Category | Video-weeks (n) | Median weekly revenue | Revenue per 1,000 views | Top 10% of video-weeks’ share | Category revenue through video |
|---|---|---|---|---|---|
| Beauty & Personal Care | 1,599 | $9K | $16.33 | 36% | 69.4% |
| Womenswear & Underwear | 784 | $15.1K | $19.47 | 24.8% | 73.8% |
| Household Appliances | 833 | $7.6K | $31.02 | 40.8% | 62.8% |
| Phones & Electronics | 1,260 | $5.1K | $12.27 | 32.4% | 64.4% |
| Sports & Outdoor | 941 | $7.2K | $18.57 | 31.3% | 63.9% |
| Home Supplies | 1,351 | $3.8K | $12.22 | 37.7% | 61% |
| Shoes | 1,057 | $5K | $26.20 | 33.2% | 72.5% |
| Furniture | 1,168 | $3.7K | $25.43 | 35.7% | 56.4% |
| Health | 1,119 | $3.7K | $20.93 | 35.6% | 64.3% |
| Textiles & Soft Furnishings | 807 | $6.2K | $16.97 | 38.8% | 67.3% |
| Tools & Hardware | 1,355 | $3.1K | $17.96 | 34.3% | 67.3% |
| Menswear & Underwear | 769 | $7.2K | $10.74 | 24.6% | 68.9% |
| Automotive & Motorcycle | 1,488 | $2.4K | $9.76 | 36.6% | 67.3% |
| Toys & Hobbies | 1,450 | $2K | $11.05 | 44% | 65% |
| Fashion Accessories | 1,412 | $2.5K | $14.38 | 30.9% | 58.2% |
Note. A video-week is one video’s estimated sales in one week it ranked among the top sellers. Category revenue through video is from the category’s own weekly figures.
6. Results: revenue per 1,000 views
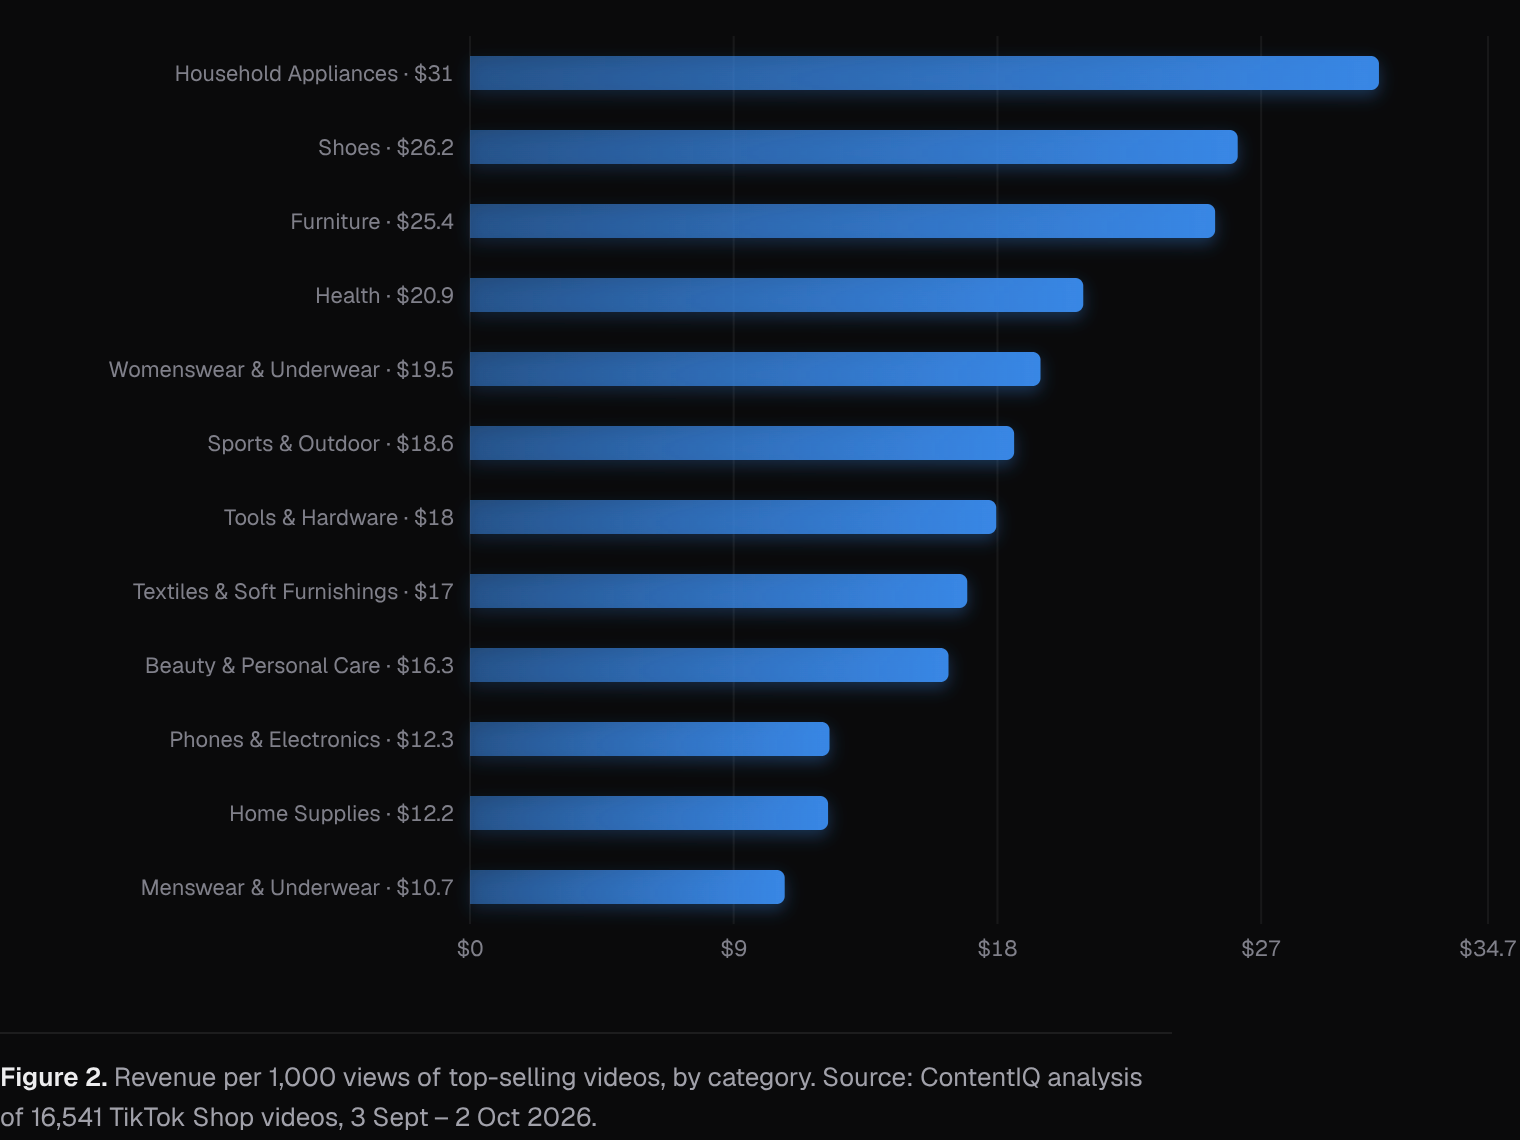
Revenue per 1,000 views ranged from $9.76 in Automotive & Motorcycle to $31.02 in Household Appliances, a gap of more than threefold. Shoes ($26.20), Furniture ($25.43), Health ($20.93) and Womenswear & Underwear ($19.47) were also above the middle. Books, Magazines & Audio ($10.03), Menswear & Underwear ($10.74), Toys & Hobbies ($11.05), Home Supplies ($12.22) and Phones & Electronics ($12.27) were among the lowest.
Views and revenue did not move together across categories. Menswear & Underwear had a median weekly revenue of $7,178 but only $10.74 per 1,000 views, while Furniture had a median of $3,678 and $25.43 per 1,000 views. A category can earn a lot per video by drawing many views, or a lot per view by converting fewer viewers, and the two call for different plans.
7. Discussion
For brands, the main pattern is that video is the largest route to revenue in nearly every category we report, yet the mix matters. Categories with high video shares, such as Baby & Maternity and Womenswear & Underwear, also have high affiliate shares (83.9% and 81.5%), consistent with creator-led selling. Categories leaning on the shop tab, such as Jewelry Accessories & Derivatives, show lower affiliate shares (43%). For creators, the same figures suggest where a hit video is worth the most per view, such as Household Appliances, Shoes and Furniture.
The results fit the long-tailed picture in prior work [szabo2010; brynjolfsson2003]: a minority of video-weeks takes a disproportionate share of revenue, by up to 44% in some categories. LIVE's larger role in Health and Household Appliances is compatible with the trust-building account of live selling [3], but we have not tested that mechanism.
Alternative explanations are plausible. Revenue per 1,000 views may reflect product price points or purchase intent in a category and not the quality of videos. The shop-tab share may reflect search-led or repeat purchasing. Because the sample contains only top sellers, selection could inflate every figure, and we cannot separate the effect of paid promotion or creator reach from video content [5]. We make no causal claims.
8. What this means for brands and founders
- Plan for video-led discovery: across categories 64.9% of revenue came through shoppable video in the latest week, against 17.1% on LIVE and 18% through the shop tab, so a video plan is associated with most of the revenue reachable.
- Plan for affiliate creators: in Household Appliances 84.3% of category revenue was credited to affiliates, against 43% in Jewelry Accessories & Derivatives, so check how creator-driven your category is before sizing a commission budget.
- Plan for uneven outcomes: the top 10% of video-weeks took 44% of revenue in Toys & Hobbies but 24.6% in Menswear & Underwear, so a few hits matter more in some categories than in others.
- Plan views against your category's yield: top-selling videos earned $9.76 per 1,000 views in Automotive & Motorcycle and $31.02 in Household Appliances, so the same reach has been associated with very different revenue.
- Plan for LIVE where it is strong: LIVE took 25.1% of revenue in Health and 24.6% in Household Appliances, but only 5.7% in Menswear & Underwear, so test it first in categories where it already sells.
9. Conclusion
In a 30-day window covering 16,541 tracked videos, shoppable video accounted for 64.9% of TikTok Shop revenue in the latest week. What a winning video earns and how efficiently its views convert differ sharply by category: medians span $885 to $15,064 a week, and revenue per 1,000 views spans $9.76 to $31.02.
The findings are descriptive, rest on top-selling videos in a single short window, and should be read as a guide to where to look, not a forecast. Repeating the analysis over longer windows would show which of these patterns are stable.
Methodology
Weekly figures for the top-selling TikTok Shop videos in the US were collected from commercial data providers: each video’s estimated revenue, views and engagement in each week it ranked, the share of its revenue and views that came from paid promotion (reported per video and top-coded at 80%), its estimated return on ad spend and its publish date. One row is one video in one week (a video-week). Weekly category figures for the US (estimated revenue, its split between video, LIVE and the shop tab, affiliate revenue, shops and active products, and a year of weekly revenue) and daily rankings of each category’s top-selling products (unit price, commission rate, launch date and revenue by channel) were collected from several independent sources. Medians of price and commission are weighted by revenue; momentum compares the latest weeks with the same number of weeks before. This paper covers 2026-09-03 to 2026-10-02: 16,541 videos tracked, 0 of them watched and analysed.
Limitations
Product figures cover the top-selling products we track in each category, not every listing, so they describe what sells best rather than everything on sale. Video figures cover top-selling videos only. Paid shares are reported per video and top-coded at 80%, so they are lower bounds; ad spend and margins are not observed, so a reported return on ad spend says nothing about profit. Results are associations, not causes. Paid promotion, creator audience size and product price are not fully controlled for. Revenue, views and sales are estimates, not figures reported by TikTok. This analysis covers top-selling videos only, so it excludes videos that did not sell and may overstate what a typical video earns. It spans one 30-day window, and the channel split reflects a single week (as of 29 Sept 2026). Category sizes differ, and we report no confidence ranges for these descriptive figures. No videos were analysed in depth, so we say nothing about content, and we have no data on price, product margin or commission rates. Collectibles appears only in the channel data and is an outlier. Everything shown is correlational.
References
- [1]Szabo, G., & Huberman, B. A. (2010). Predicting the popularity of online content. Communications of the ACM, 53(8), 80–88. cacm.acm.org/research/predicting-the-popularity-of-online-content
- [2]Brynjolfsson, E., Hu, Y. J., & Smith, M. D. (2003). Consumer surplus in the digital economy: Estimating the value of increased product variety at online booksellers. Management Science, 49(11), 1580–1596.
- [3]Wongkitrungrueng, A., & Assarut, N. (2020). The role of live streaming in building consumer trust and engagement with social commerce sellers. Journal of Business Research, 117, 543–556.
- [4]Libai, B., Biyalogorsky, E., & Gerstner, E. (2003). Setting referral fees in affiliate marketing. Journal of Service Research, 5(4), 303–315.
- [5]Lewis, R. A., & Rao, J. M. (2015). The unfavorable economics of measuring the returns to advertising. The Quarterly Journal of Economics, 130(4), 1941–1973.
Cite as
MediaLabs Research, in collaboration with Coherence Limited (2026). Shoppable video carries 64.9% of TikTok Shop revenue, and revenue per 1,000 views runs from $9.76 to $31.02 by category. ContentIQ Working Paper CIQ-WP-2026-45, version 1. https://medialabs-co.com/research/founders-winning-video-economics
Analysis and data: Coherence Research, Coherence ContentIQ. Published by MediaLabs in collaboration with Coherence Limited.
Version history
- Version 12 Oct 2026This version