ContentIQ working paperCIQ-WP-2026-42FoundersVersion 12 Oct 2026
Affiliate creators sold 75.8% of TikTok Shop revenue, brands’ own accounts 11.5%
2,800 top-selling products, 29 categories, 3 Sept–2 Oct 2026
MediaLabs Research · in collaboration with Coherence Limited
Key findings
- 0175.8%of latest-week revenue was credited to affiliate creators
- 0211.5%was sold by shops’ own accounts; 12.7% was other
- 03r = 0.93affiliate share against video share across 26 categories
- 04r = 0.67own-account share against LIVE share across 26 categories
- 059%revenue-weighted median commission for each category’s top 10 products
- 0612 of 28categories where the top 10 pay a higher median commission than ranks 11–100 (9 pay less)
Contents
Abstract
In the latest week we observed, 75.8% of TikTok Shop revenue across the top sellers in our sample was credited to affiliate creators and 11.5% to shops’ own accounts; the remaining 12.7% was neither. Across categories, a higher affiliate share went with a higher video share of revenue (r = 0.93, 26 categories), while a higher own-account share went with a higher LIVE share (r = 0.67). Revenue-weighted median commission was 9% for each category’s top 10 products and 9–10% for lower ranks, and top sellers did not systematically pay more than the rest. The evidence covers one week and is correlational, so it describes how revenue is currently credited, not what a creator programme will deliver.
1. Introduction
Brands on TikTok Shop face a practical choice: build a programme that pays affiliate creators to sell, or invest in their own account, through video, LIVE and the shop tab. The answer differs by category, and it determines how much of a budget goes to commissions, creator relations and content production.
This paper asks how much revenue is sold by affiliate creators against brands’ own accounts in each category, how that goes with the sales channel, and what commission rates look like among top sellers. Prior work on affiliate marketing treats the referral fee as a design choice that varies with the economics of the seller and the referrer [1]. Research on live-stream selling suggests it can build trust and engagement with social commerce sellers [2]. Measuring the returns to promotion from observational data is hard [3], so we describe associations and make no claims about effects.
2. Data
Our analysis covers 2,800 top-selling products across 29 categories, in the window 3 September to 2 October 2026. The market figures rest on revenue in the latest week only (one week observed, as of 2 October 2026), so they are a snapshot and not a trend.
For each product we recorded its rank by revenue within its category, revenue credited to affiliate creators and to own accounts, the split across video, LIVE and the shop tab, its listed commission rate, and its price. This edition has no video-level analysis; all findings are at the level of products and categories.
Weekly category figures for the US (estimated revenue, its split between video, LIVE and the shop tab, affiliate revenue, shops and active products, and a year of weekly revenue) and daily rankings of each category’s top-selling products (unit price, commission rate, launch date and revenue by channel) were collected from several independent sources. Medians of price and commission are weighted by revenue; momentum compares the latest weeks with the same number of weeks before. This paper covers 2026-09-03 to 2026-10-02: 2,800 top-selling products across 29 categories.
3. Methods
Affiliates and own accounts: each category’s latest-week revenue was split into revenue credited to affiliate creators, revenue sold by the shops’ own accounts and the remainder, together with the category’s split across video, LIVE and the shop tab. We computed Pearson correlations across categories between these shares [1]. The correlations use 26 categories and no confidence ranges are reported for them.
Commission by rank: products were ranked by revenue among each category’s tracked top sellers in the latest week. We report revenue-weighted median commission rates by rank band (top 10, 11–25, 26–50, 51–100) and for each category’s top 10 against ranks 11–100. Products listed at 0% commission are left out of the medians and reported separately as a share [1].
4. Results: who sells the revenue
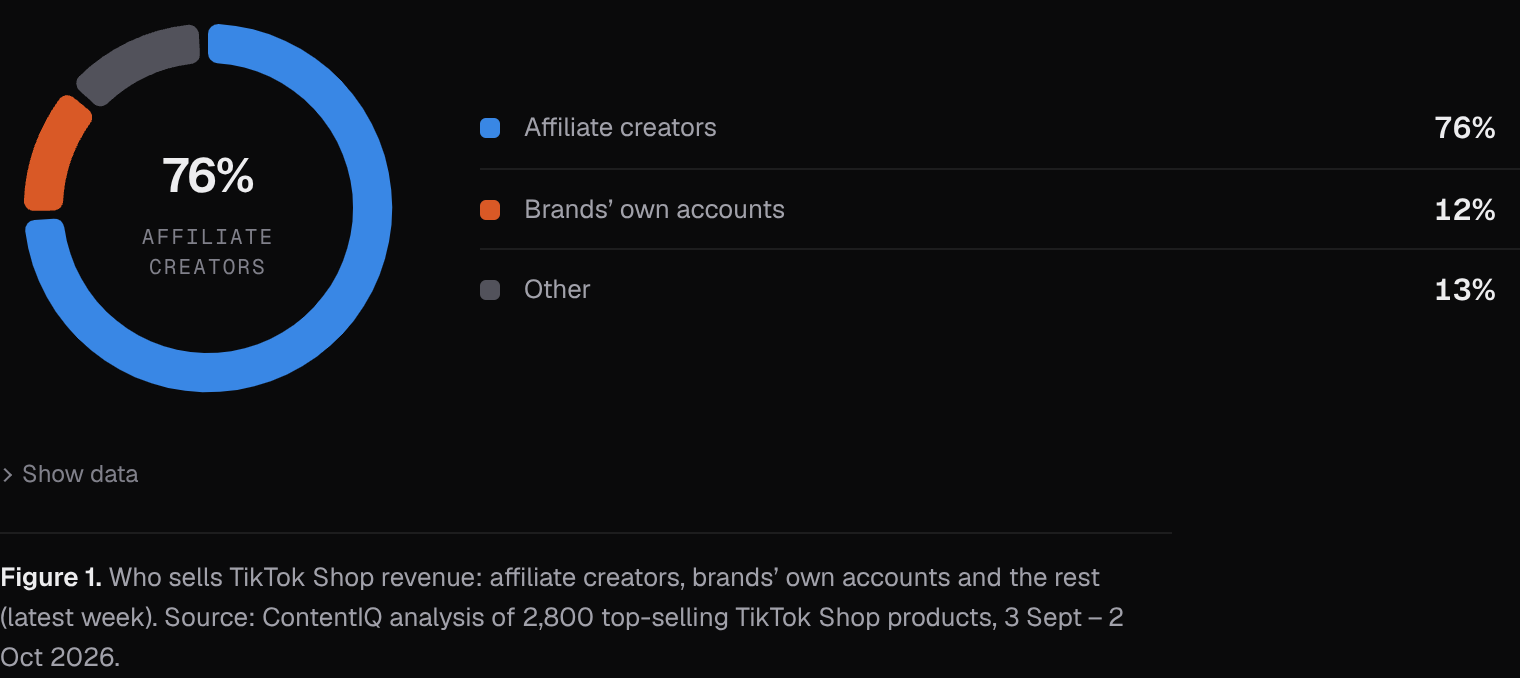
Across the market, 75.8% of latest-week revenue was credited to affiliate creators and 11.5% to brands’ own accounts. The remaining 12.7% was neither. Affiliates therefore account for roughly 6.6 times the revenue of own accounts in our sample.
Across 26 categories, the affiliate share of revenue and the video share of revenue moved together closely (r = 0.93). The own-account share and the LIVE share were also positively associated, but more loosely (r = 0.67). These are cross-category correlations from a single week: categories that lean on video tend to be those where affiliates carry the revenue, and categories with more own-account revenue tend to have more LIVE, which does not show that either channel drives the other.
5. Results: commission by rank
Commission rates were flat across rank. The revenue-weighted median was 9% for the top 10 products in each category, 10% for ranks 11–25, and 9% for both 26–50 and 51–100. The top 10 accounted for 30.7% of revenue across 280 products, and ranks 51–100 for 28% across 1,400 products.
A sizeable minority of products carried no commission: 20.4% of top 10 products were listed at 0%, against 18.3% at ranks 11–25, 24.7% at 26–50 and 22.8% at 51–100. These are excluded from the medians. The revenue-weighted median price was $43 in the top 10 and $38–39 in lower bands. Video accounted for 78.8% of revenue in the top 10 and 75.2–78.3% in the other bands, so the channel mix hardly differs by rank.
| Rank in category | Products (n) | Share of revenue | Median commission | Listed at 0% | Median price | Sold through video |
|---|---|---|---|---|---|---|
| Top 10 | 280 | 30.7% | 9% | 20.4% | $43.00 | 78.8% |
| 11–25 | 420 | 20% | 10% | 18.3% | $39.00 | 75.2% |
| 26–50 | 700 | 21.3% | 9% | 24.7% | $38.00 | 76.9% |
| 51–100 | 1,400 | 28% | 9% | 22.8% | $38.00 | 78.3% |
Note. Ranks are by revenue among each category’s tracked top-selling products in the latest week. Medians are weighted by revenue; the commission median leaves out products listed at 0%.
6. Results: do top sellers pay more than the rest?
Among the 28 categories compared, the top 10 had a higher median commission than ranks 11–100 in 12 categories and a lower one in 9; the other 7 showed no difference at the median. There is no consistent pattern in which top sellers pay more.
Categories differ widely. Health had the highest rates (20% for the top 10, 19% for the rest). Furniture (9% against 6%) and Fashion Accessories (6% against 3%) paid the top 10 more. Computers & Office Equipment (5% against 8%), Automotive & Motorcycle (6% against 10%) and Tools & Hardware (4% against 6%) paid them less. In Collectibles, 90% of the top 10 were listed at 0% and the medians were 2% and 3%. Each category rests on 100 products, and 10 in the top group, so single-category differences of a point or two are thin evidence.
| Category | Top 10 median | Ranks 11–100 median | Top 10 listed at 0% |
|---|---|---|---|
| Beauty & Personal Care | 13% | 14% | 10% |
| Womenswear & Underwear | 9% | 8% | 10% |
| Sports & Outdoor | 7% | 8% | 0% |
| Health | 20% | 19% | 0% |
| Household Appliances | 5% | 5% | 30% |
| Phones & Electronics | 8% | 8% | 30% |
| Shoes | 10% | 9% | 0% |
| Textiles & Soft Furnishings | 11% | 10% | 20% |
| Furniture | 9% | 6% | 10% |
| Home Supplies | 11% | 9% | 30% |
| Menswear & Underwear | 8% | 9% | 10% |
| Home Improvement | 7% | 7% | 10% |
| Tools & Hardware | 4% | 6% | 0% |
| Fashion Accessories | 6% | 3% | 40% |
| Automotive & Motorcycle | 6% | 10% | 20% |
Note. Revenue-weighted median commission rates, leaving out products listed at 0%.
7. Discussion
For most categories in our sample, affiliate creators account for most of the revenue, and that revenue is predominantly sold through video. A brand that relies only on its own account would be competing for the 11.5% of revenue that own accounts sold, in a market where the creator channel is more than six times larger. A creator programme is therefore likely to be central to a launch strategy, not an add-on, but this is an observation of where revenue is credited, not proof that adding affiliates raises sales.
Commission levels look category-specific rather than rank-specific. This is consistent with the view that referral fees reflect the economics of each seller, such as margin and price, rather than a premium for proven performers [1]. The link between own-account share and LIVE share fits the idea that live selling suits sellers building direct trust with buyers [2], but the correlation is moderate.
Alternative explanations are many. Affiliate-heavy categories may simply be those with products that demonstrate well on video. Rates listed are not necessarily rates paid, and 0% listings may reflect private or negotiated terms. Revenue credited to affiliates may include sales that would have occurred anyway [3]. Finally, we observed a single week, which may be affected by seasonal events.
8. What this means for brands and founders
- Plan for creators first: in the latest week 75.8% of revenue was credited to affiliate creators and 11.5% to brands’ own accounts, so a creator programme is likely to matter more than your own account’s reach.
- Benchmark commission in your own category: the top 10 paid a higher median than ranks 11–100 in 12 of 28 categories and a lower one in 9, so a rate that works in one category may not transfer to another.
- Build for video: across 26 categories, affiliate share went with video share (r = 0.93), and video made up 78.8% of revenue for top 10 products, so budget for creator video content and samples.
- Treat 0% listings with caution: 20.4% of top 10 products were listed at 0% commission, which may reflect special terms, so do not read it as proof you can recruit creators for free.
- Test LIVE on your own account: own-account share was associated with LIVE share (r = 0.67), so consider a small LIVE test if you want to grow revenue that does not rely on affiliates.
9. Conclusion
In the latest week, affiliate creators were credited with 75.8% of revenue among top sellers and brands’ own accounts with 11.5%. Affiliate share closely tracked video share across categories (r = 0.93), and own-account share was moderately associated with LIVE share (r = 0.67).
Commission at the top is not systematically higher: the median was 9% for the top 10, and top sellers paid more in 12 categories and less in 9 of 28. Brands should benchmark within their own category rather than against the market. Repeating this analysis over more weeks would show how stable these splits and rates are.
Methodology
Weekly category figures for the US (estimated revenue, its split between video, LIVE and the shop tab, affiliate revenue, shops and active products, and a year of weekly revenue) and daily rankings of each category’s top-selling products (unit price, commission rate, launch date and revenue by channel) were collected from several independent sources. Medians of price and commission are weighted by revenue; momentum compares the latest weeks with the same number of weeks before. This paper covers 2026-09-03 to 2026-10-02: 2,800 top-selling products across 29 categories.
Limitations
Product figures cover the top-selling products we track in each category, not every listing, so they describe what sells best rather than everything on sale. Results are associations, not causes. Paid promotion, creator audience size and product price are not fully controlled for. Revenue, views and sales are estimates, not figures reported by TikTok. The market figures rest on one week of data, so they cannot show trends or seasonality. No video-level analysis is included in this edition. Correlations are across 26 categories and come without confidence ranges. Commission figures are listed rates, not rates paid, and exclude products at 0%. Each category rests on about 100 top-selling products, so category-level differences of a point or two are weak evidence. All findings are associations.
References
- [1]Libai, B., Biyalogorsky, E., & Gerstner, E. (2003). Setting referral fees in affiliate marketing. Journal of Service Research, 5(4), 303–315.
- [2]Wongkitrungrueng, A., & Assarut, N. (2020). The role of live streaming in building consumer trust and engagement with social commerce sellers. Journal of Business Research, 117, 543–556.
- [3]Lewis, R. A., & Rao, J. M. (2015). The unfavorable economics of measuring the returns to advertising. The Quarterly Journal of Economics, 130(4), 1941–1973.
Cite as
MediaLabs Research, in collaboration with Coherence Limited (2026). Affiliate creators sold 75.8% of TikTok Shop revenue, brands’ own accounts 11.5%. ContentIQ Working Paper CIQ-WP-2026-42, version 1. https://medialabs-co.com/research/founders-creator-programmes
Analysis and data: Coherence Research, Coherence ContentIQ. Published by MediaLabs in collaboration with Coherence Limited.
Version history
- Version 12 Oct 2026This version