ContentIQ working paperCIQ-WP-2026-18CreativeVersion 11 Oct 2026
Ads and organic videos sell at similar rates among top TikTok Shop sellers, but the openings that work differ
13,304 videos tracked, 3,342 analysed in depth, 29 categories, 2 Sept–1 Oct 2026
MediaLabs Research · in collaboration with Coherence Limited
Key findings
- 0189.1%of sales in the sample came from videos that ran as ads
- 020.995 vs 1.042sales per view, ads vs organic (1 = market average); ranges overlap
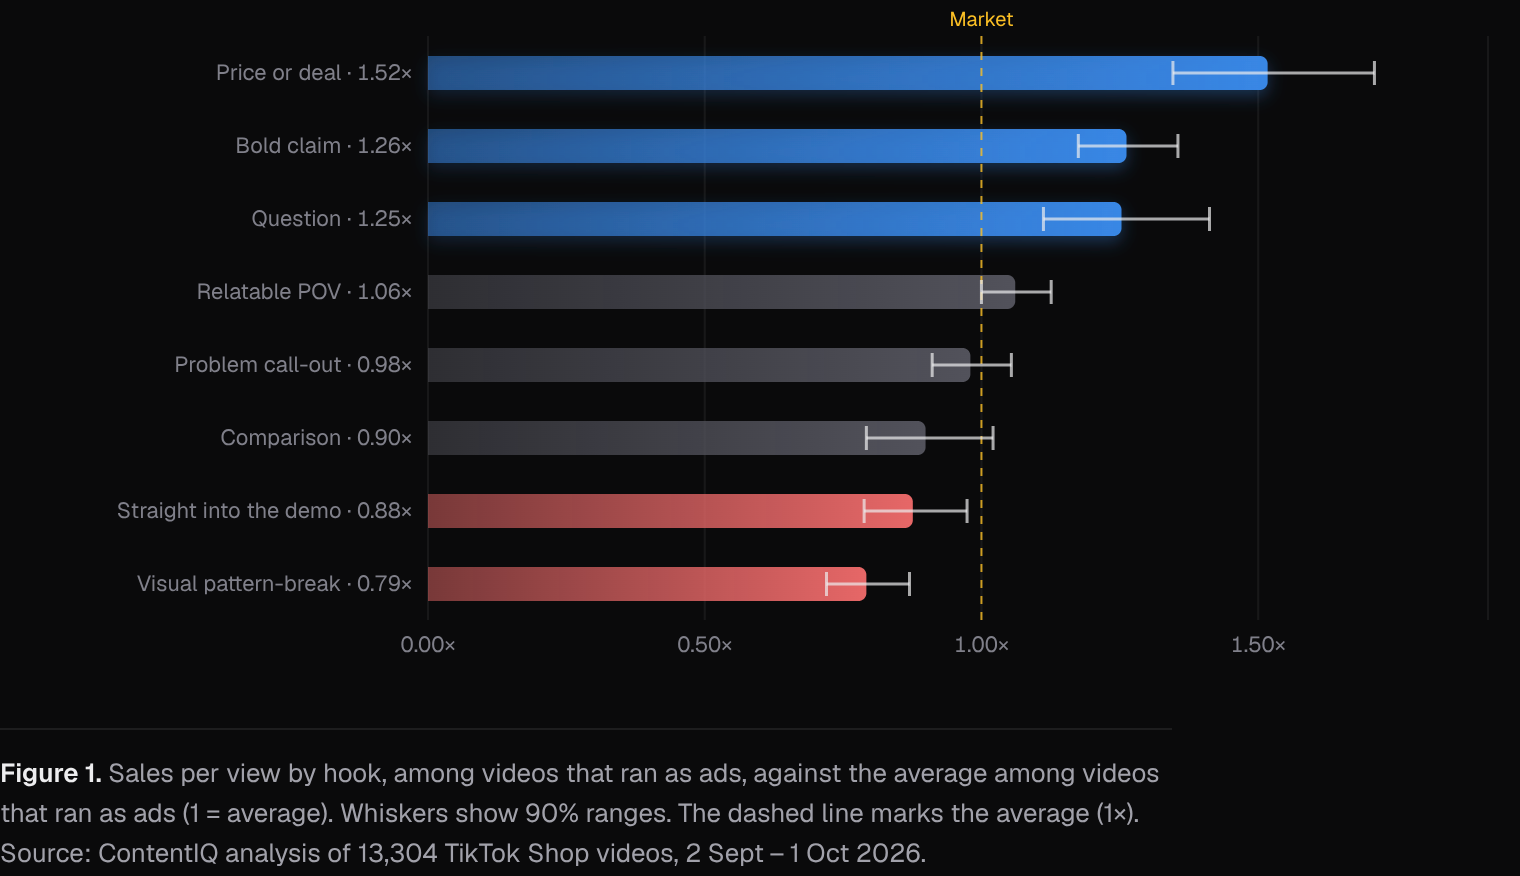
- 031.5×sales per view for price or deal hooks among ads (90% range 1.35–1.71)
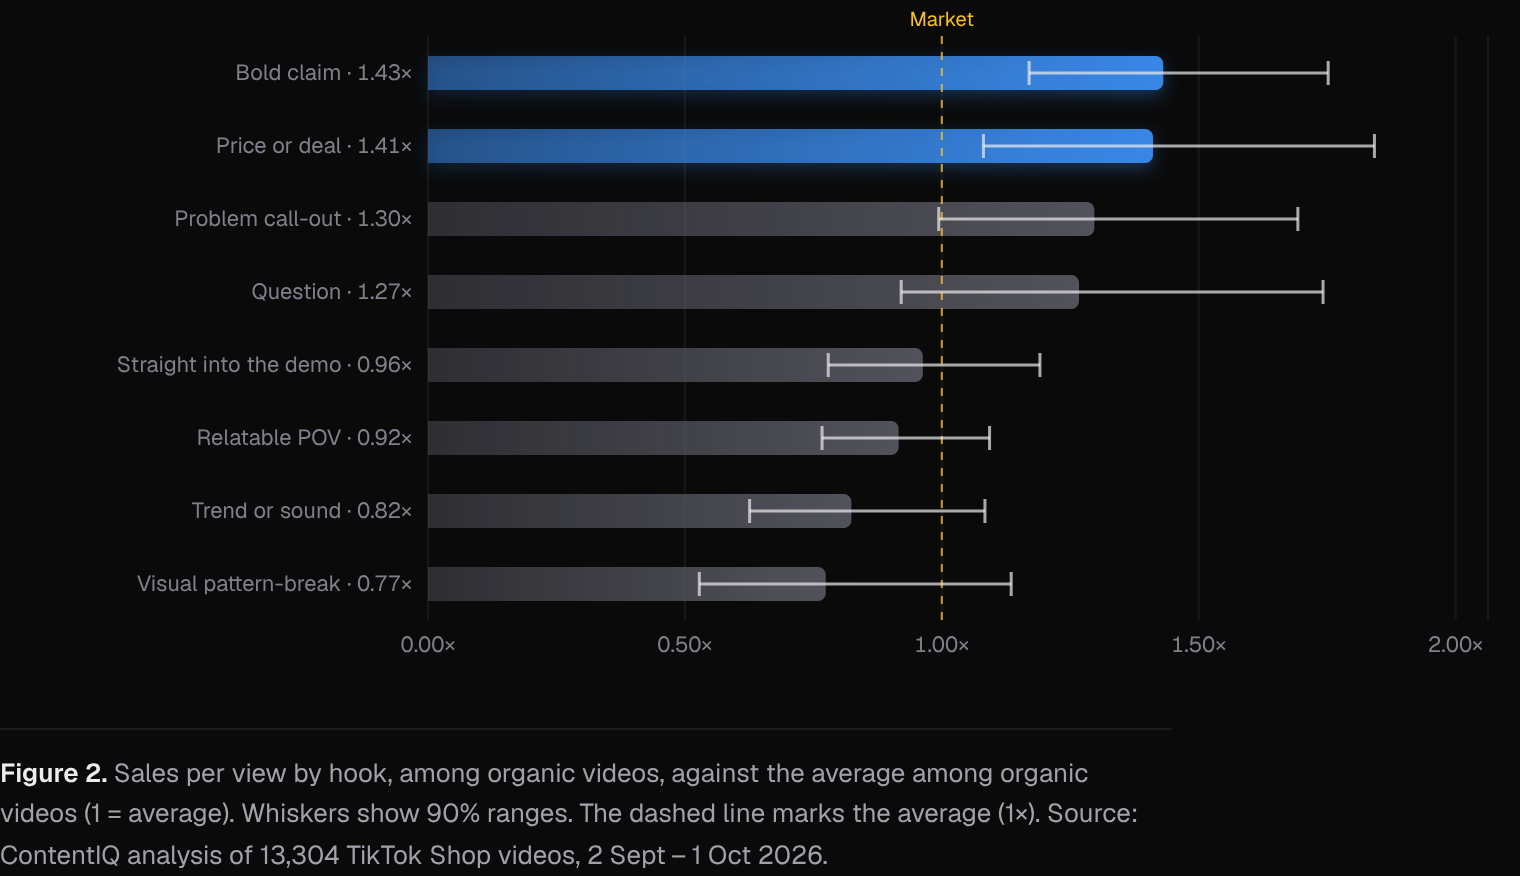
- 041.4×sales per view for bold claim hooks among organic videos (90% range 1.17–1.75)
- 050.88×sales per view for opening straight into the demo among ads (90% range 0.79–0.97)
- 060.641AUC of the top-seller model (90% range 0.573–0.696)
Contents
Abstract
We compare videos that ran as ads with organic videos among top-selling TikTok Shop content. Videos that ran as ads account for 89.1% of sales in the sample, yet their sales per view (0.995) are statistically indistinguishable from organic videos (1.042). Hook style is where the two groups part: price or deal openings sell at 1.5× the average among ad videos, while bold claims lead among organic videos at 1.4×. A predictive model of top-selling videos has only modest accuracy (AUC 0.641), so these patterns are associations, not recipes.
1. Introduction
Brands and creators on TikTok Shop must decide whether to put paid support behind a video and how to open it. The two questions are linked: a hook that works for an organic audience may not work for an audience reached through an ad. Prior work on short-video popularity shows that attention is long-tailed and that early popularity predicts later popularity [1]. Recent prediction benchmarks find that creator features matter most and that content features add comparatively little [2, 3]. Separately, the returns to advertising are hard to measure from observational data [4]. This paper therefore asks a descriptive question: among top-selling videos, how do those that ran as ads differ from organic ones, and which openings sell best in each group?
2. Data
We tracked 13,304 videos across 29 categories from 2 September to 1 October 2026. Our AI analyst watched and analysed 3,342 of them in depth, recording the hook, format and whether the video ran as an ad. Ad status was known for 3,213 videos, and the paid-versus-organic comparison rests on those.
Daily rankings of top-selling TikTok Shop videos in the US were collected from several independent sources and merged into one record per video. Where sources overlap, their sales estimates are cross-checked against each other, and videos whose estimates disagree by more than half are flagged. An AI analyst watched each video and recorded its opening, format, angle, production style, use of AI, hook source, length, pacing and what appears in the first second, without seeing how the video sold. Sales per view is a video group’s revenue per view divided by the market’s, shrunk toward the average for small groups, with 90% ranges. This paper covers 2026-09-02 to 2026-10-01: 13,304 videos tracked, 3,342 of them watched and analysed. Predictions come from a logistic model retrained daily and tested on recent weeks it had not seen.
3. Methods
Sales per view is a group's revenue per view divided by the market's, so 1 is the market average. Estimates for small groups are shrunk toward the average by empirical Bayes [5], and we report 90% intervals on the log scale. Hook comparisons within a group (ads or organic) are indexed to that group's own average, so ad and organic hook figures are not directly comparable.
4. Results: ads and organic videos sell at similar rates
Videos that ran as ads (2,734) account for 89.1% of sales, against 10.9% for organic videos (478). Per view, however, the two groups are close. Ads sell at 0.995 of the market average (90% range 0.966–1.024) and organic videos at 1.042 (0.957–1.135). The ranges overlap almost entirely, so we cannot say either group converts views to sales better.
| Value | Videos (n) | Share of sales | Sales per view | 90% range |
|---|---|---|---|---|
| Ran as an ad | 2,734 | 89.1% | 0.99× | 0.97–1.02 |
| Organic | 478 | 10.9% | 1.04× | 0.96–1.14 |
Note. Sales per view is relative to the market (1.00 = average), shrunk toward the average for small groups (empirical Bayes); ranges are 90% intervals on the log scale.
5. Results: price and bold-claim hooks lead among ads
Among videos that ran as ads, price or deal openings sell at 1.517× the ad average (90% range 1.346–1.71; 160 videos, 5.3% of sales). Bold claims (1.262; 1.175–1.355) and questions (1.253; 1.112–1.412) also sit clearly above average. Relatable POV is the largest group, with 559 videos and 20.8% of sales, and sells at 1.061 (1–1.126), close to average. Opening straight into the demo sells below average at 0.876 (0.788–0.974). The very small groups, other (19 videos) and list or countdown (16), have wide ranges and medium confidence.
6. Results: bold claims and deals lead among organic videos
Among organic videos, bold claims sell at 1.431× the organic average (90% range 1.17–1.752; 65 videos, 15.4% of sales). Price or deal openings follow at 1.411 (1.081–1.842). Problem call-outs sit at 1.297, but their range (0.994–1.693) reaches below 1. Trend or sound openings (0.824; 0.626–1.084) and relatable POV (0.916; 0.767–1.093) fall below average, though both ranges include 1. Organic groups are small, and test or challenge (9 videos) and ASMR or sensory (5) carry low confidence and should not be read as findings.
7. Discussion
Price or deal and bold-claim hooks lead in both groups, which suggests a clear, concrete promise at the start is associated with better sales per view whether or not money is spent on reach. Straight-to-demo openings lag among ads, and trend or sound openings lag among organic videos, though the organic range includes 1. The result that ads and organic videos sell at similar rates should not be read as ads having no effect. Videos that are boosted are likely already chosen for being promising, and observational data cannot separate the two [4]. Our model of top-selling videos reaches an AUC of 0.641 (90% range 0.573–0.696), trained on 2,667 rows [6, 7]. It was not restricted to analyses that never saw sales (cleanOnly is false), so its drivers should be read with caution. Boosted with ads has an odds ratio of 1.59, behind filmed live action at 2.54. For brands, the practical reading is to test price, claim and question openings first. For creators, it is to avoid assuming that a hook that works in paid distribution will work organically.
8. Conclusion
Among top-selling TikTok Shop videos, ads carry most of the sales (89.1%) but sell at about the same rate per view as organic videos. Opening style is associated with larger differences than ad status: price or deal and bold-claim hooks sell above average in both groups. These are associations from a one-month window and small organic groups, and they are best used to choose what to test next.
Methodology
Daily rankings of top-selling TikTok Shop videos in the US were collected from several independent sources and merged into one record per video. Where sources overlap, their sales estimates are cross-checked against each other, and videos whose estimates disagree by more than half are flagged. An AI analyst watched each video and recorded its opening, format, angle, production style, use of AI, hook source, length, pacing and what appears in the first second, without seeing how the video sold. Sales per view is a video group’s revenue per view divided by the market’s, shrunk toward the average for small groups, with 90% ranges. This paper covers 2026-09-02 to 2026-10-01: 13,304 videos tracked, 3,342 of them watched and analysed. Predictions come from a logistic model retrained daily and tested on recent weeks it had not seen.
Limitations
Most videos in the sample are top-ranked, so findings mostly separate strong sellers from good ones rather than from all videos; typical and weak videos are being added. Results are associations, not causes. Paid promotion, creator audience size and product price are not fully controlled for. Revenue, views and sales are estimates, not figures reported by TikTok. The window is one month, and organic videos (478) are far fewer than ads (2,734), so organic hook estimates are wide and several are low or medium confidence. Ad status was known for only 3,213 videos. The ad and organic hook indices use different baselines and cannot be compared directly. The model's accuracy is modest, and it was not trained only on analyses that never saw sales.
References
- [1]Szabo, G., & Huberman, B. A. (2010). Predicting the popularity of online content. Communications of the ACM, 53(8), 80–88. cacm.acm.org/research/predicting-the-popularity-of-online-content
- [2]Ye, L., Zhang, Y., Wu, Y., et al. (2025). MVP: Winning solution to SMP Challenge 2025 video track. arXiv:2507.00950. arxiv.org/abs/2507.00950
- [3]Lu, J., Wang, W., Xiao, M., et al. (2024). M3TR: Temporal retrieval enhanced multi-modal micro-video popularity prediction. arXiv:2411.15455. arxiv.org/abs/2411.15455
- [4]Lewis, R. A., & Rao, J. M. (2015). The unfavorable economics of measuring the returns to advertising. The Quarterly Journal of Economics, 130(4), 1941–1973.
- [5]Efron, B., & Morris, C. (1975). Data analysis using Stein’s estimator and its generalizations. Journal of the American Statistical Association, 70(350), 311–319.
- [6]Fawcett, T. (2006). An introduction to ROC analysis. Pattern Recognition Letters, 27(8), 861–874.
- [7]Efron, B., & Tibshirani, R. J. (1993). An Introduction to the Bootstrap. Chapman & Hall.
Cite as
MediaLabs Research, in collaboration with Coherence Limited (2026). Ads and organic videos sell at similar rates among top TikTok Shop sellers, but the openings that work differ. ContentIQ Working Paper CIQ-WP-2026-18, version 1. https://medialabs-co.com/research/paid-and-organic-video
Analysis and data: Coherence Research, Coherence ContentIQ. Published by MediaLabs in collaboration with Coherence Limited.
Version history
- Version 11 Oct 2026This version