ContentIQ working paperCIQ-WP-2026-17CreativeVersion 11 Oct 2026
A face in the first second is associated with higher sales per view on TikTok Shop
13,304 videos tracked, 3,342 analysed in depth, 2 Sept–1 Oct 2026
MediaLabs Research · in collaboration with Coherence Limited
Key findings
- 011.05×sales per view for videos opening with a face (range 1.01–1.09), versus 0.94× without
- 021.08×sales per view when face, text and product all appear in the first second (range 1.02–1.14)
- 030.88×sales per view when only one of the three appears (range 0.82–0.95)
- 0482%of watched-video sales came from videos showing the product in the first second
- 050.64AUC of the predictive model (range 0.573–0.696): modest ranking power
Contents
Abstract
We examined what is on screen in the first second of top-selling TikTok Shop videos (a face, text, the product) and how each choice relates to sales per view. Videos opening with a face sold at 1.05× the market average (90% range 1.01–1.09), against 0.94× (0.90–0.98) for those without one. Stacking elements mattered more than any single one: videos showing all three sold at 1.08× (1.02–1.14) and those showing only one at 0.88× (0.82–0.95). These are associations from observational data, and a model built on these features ranks top sellers only modestly (AUC 0.64, range 0.57–0.70).
1. Introduction
Brands and creators on TikTok Shop make a large number of decisions before a viewer decides whether to keep watching. The opening second is the cheapest of these to change: whether to show a face, put text on screen or lead with the product. We ask how each of these choices relates to sales per view among top-selling videos.
Prior work on short-video popularity finds that attention is long-tailed and that early engagement predicts later popularity [1]. Recent benchmark solutions to short-video popularity prediction find that creator-level features carry most of the signal, with content features adding less [2], and multimodal approaches continue to improve on them [3]. Less is known about commerce outcomes, where the question is revenue per view rather than views alone.
This matters because creative advice tends to be given as rules (always show the product, always add text). We test whether those rules show up in sales per view, and how large the differences are given the uncertainty.
2. Data
Our analysis covers TikTok Shop from 2 September to 1 October 2026 across 29 categories. We tracked 13,304 videos in the window, and our AI analyst watched and analysed 3,342 of them in depth. The first-second results below rest on the videos for which the first second was recorded.
For each analysed video we recorded whether a face, on-screen text and the product were visible in the first second, along with other creative features used in the model. Sales are those attributed to the video in the window.
Daily rankings of top-selling TikTok Shop videos in the US were collected from several independent sources and merged into one record per video. Where sources overlap, their sales estimates are cross-checked against each other, and videos whose estimates disagree by more than half are flagged. An AI analyst watched each video and recorded its opening, format, angle, production style, use of AI, hook source, length, pacing and what appears in the first second, without seeing how the video sold. Sales per view is a video group’s revenue per view divided by the market’s, shrunk toward the average for small groups, with 90% ranges. This paper covers 2026-09-02 to 2026-10-01: 13,304 videos tracked, 3,342 of them watched and analysed. Predictions come from a logistic model retrained daily and tested on recent weeks it had not seen.
3. Methods
Sales per view is a group of videos' revenue per view divided by the market's, so 1 is the market average. Estimates for small groups are shrunk toward the average by empirical Bayes [4], and we report 90% intervals on the log scale. Where intervals include 1, we do not treat the group as clearly different from average.
The predictive model is a logistic model of top-selling videos, retrained daily and tested on recent weeks it had not seen (a time split). We report AUC as a ranking measure [5], with a bootstrap range [6].
4. Results: face, text and product in the first second
Videos opening with a face accounted for 59% of sales in the watched set and sold at 1.05× the market average (90% range 1.01–1.09). Videos without a face sold at 0.94× (0.90–0.98). Both ranges exclude 1 and do not overlap, so this is the clearest single-element difference.
The product on screen shows a similar direction. Videos showing the product in the first second accounted for 82% of sales and sold at 1.02× (0.99–1.05); those without it sold at 0.91× (0.85–0.98). Text was the weakest signal: 1.01× with text (0.98–1.05) against 0.97× without (0.92–1.03), with heavily overlapping ranges.
These are associations. Videos without the product at the start are fewer (466 against 2,433), so that comparison rests on a smaller group.
| In the first second | Videos (n) | Share of sales | Sales per view | 90% range |
|---|---|---|---|---|
| Face in the first second: yes | 1,610 | 58.7% | 1.05× | 1.01–1.09 |
| Face in the first second: no | 1,289 | 41.3% | 0.94× | 0.90–0.98 |
| Text on screen in the first second: yes | 1,962 | 69.9% | 1.01× | 0.98–1.05 |
| Text on screen in the first second: no | 937 | 30.1% | 0.97× | 0.92–1.02 |
| Product in the first second: yes | 2,433 | 82.4% | 1.02× | 0.99–1.05 |
| Product in the first second: no | 466 | 17.6% | 0.91× | 0.85–0.98 |
Note. Each pair splits the same videos; sales per view is relative to the market (1.00 = average), shrunk toward the average for small groups; ranges are 90% intervals.
5. Results: how many elements appear together
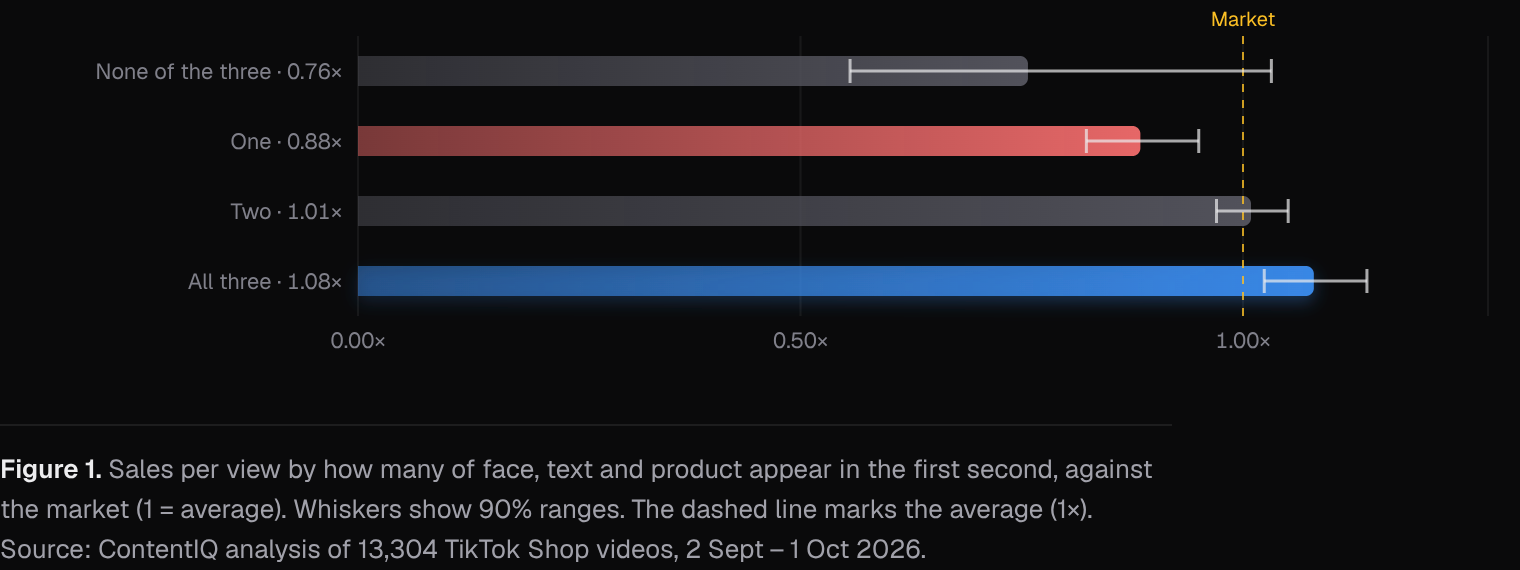
Sales per view rises with the number of elements present. Videos with all three sold at 1.08× (1.02–1.14) and accounted for 31% of sales. Two elements sold at 1.01× (0.97–1.05) and accounted for 50% of sales. One element sold at 0.88× (0.82–0.95), and 19% of sales.
Videos with none of the three are rare (22 videos, 0.6% of sales) and sold at 0.76× (0.56–1.03). That range includes 1, and the group is too small to read much into.
The pattern suggests the benefit is in combining elements rather than any single one, though the gap between two and all three is within the uncertainty of the two-element range.
6. Results: how well the first second predicts top sellers
The logistic model separates top-selling videos from others with an AUC of 0.64 (90% range 0.573–0.696), trained on 2,667 rows. It was not restricted to analyses that never saw sales (cleanOnly is false), so its figure should be read as indicative rather than as a clean test of creative features alone.
The largest odds ratios were for filmed live action (2.5), a visual pattern-break combined with a review or testimonial (1.9) and no visible AI (1.7). Product in the first second had an odds ratio of 0.62 once other features were included, which differs from its raw association above and shows that these features overlap.
7. Discussion
For brands and creators, the evidence supports opening with a human face and layering text and the product on top, rather than relying on one element. The effects are small, however: the strongest group sold at about 1.08× the average, so the first second is one lever among many.
These results sit alongside prior work in which creator-level features dominate popularity prediction [2]; our modest AUC is consistent with the first second being a limited predictor. Alternative explanations are plausible. Creators with larger budgets may both produce richer openings and benefit from existing audiences or paid promotion, and measuring the returns to advertising from observational data is notoriously hard [7]. The model's boosted-with-ads term (odds ratio 1.59) is a reminder of this.
8. Conclusion
Among top-selling TikTok Shop videos, opening with a face and combining face, text and product in the first second are associated with higher sales per view. Differences are modest and some ranges overlap, so we recommend testing openings rather than treating them as rules. We cannot claim that changing the first second causes higher sales.
Methodology
Daily rankings of top-selling TikTok Shop videos in the US were collected from several independent sources and merged into one record per video. Where sources overlap, their sales estimates are cross-checked against each other, and videos whose estimates disagree by more than half are flagged. An AI analyst watched each video and recorded its opening, format, angle, production style, use of AI, hook source, length, pacing and what appears in the first second, without seeing how the video sold. Sales per view is a video group’s revenue per view divided by the market’s, shrunk toward the average for small groups, with 90% ranges. This paper covers 2026-09-02 to 2026-10-01: 13,304 videos tracked, 3,342 of them watched and analysed. Predictions come from a logistic model retrained daily and tested on recent weeks it had not seen.
Limitations
Most videos in the sample are top-ranked, so findings mostly separate strong sellers from good ones rather than from all videos; typical and weak videos are being added. Results are associations, not causes. Paid promotion, creator audience size and product price are not fully controlled for. Revenue, views and sales are estimates, not figures reported by TikTok. The window is a single month, so seasonal or retail-moment effects are not separated. The first-second analysis rests on videos our AI analyst watched, a subset of those tracked, and some groups are small (22 videos with none of the three elements; 466 without the product). The model was not trained only on analyses that never saw sales, and its AUC range is wide. Creator size, ad spend and category mix are not fully controlled.
References
- [1]Szabo, G., & Huberman, B. A. (2010). Predicting the popularity of online content. Communications of the ACM, 53(8), 80–88. cacm.acm.org/research/predicting-the-popularity-of-online-content
- [2]Ye, L., Zhang, Y., Wu, Y., et al. (2025). MVP: Winning solution to SMP Challenge 2025 video track. arXiv:2507.00950. arxiv.org/abs/2507.00950
- [3]Lu, J., Wang, W., Xiao, M., et al. (2024). M3TR: Temporal retrieval enhanced multi-modal micro-video popularity prediction. arXiv:2411.15455. arxiv.org/abs/2411.15455
- [4]Efron, B., & Morris, C. (1975). Data analysis using Stein’s estimator and its generalizations. Journal of the American Statistical Association, 70(350), 311–319.
- [5]Fawcett, T. (2006). An introduction to ROC analysis. Pattern Recognition Letters, 27(8), 861–874.
- [6]Efron, B., & Tibshirani, R. J. (1993). An Introduction to the Bootstrap. Chapman & Hall.
- [7]Lewis, R. A., & Rao, J. M. (2015). The unfavorable economics of measuring the returns to advertising. The Quarterly Journal of Economics, 130(4), 1941–1973.
Cite as
MediaLabs Research, in collaboration with Coherence Limited (2026). A face in the first second is associated with higher sales per view on TikTok Shop. ContentIQ Working Paper CIQ-WP-2026-17, version 1. https://medialabs-co.com/research/the-first-second
Analysis and data: Coherence Research, Coherence ContentIQ. Published by MediaLabs in collaboration with Coherence Limited.
Version history
- Version 11 Oct 2026This version