ContentIQ working paperCIQ-WP-2026-11TikTok ShopVersion 11 Oct 2026
Higher affiliate commission goes with more revenue per top-selling product on TikTok Shop, but the pattern has limits
2,188 top-selling products across 29 categories, 2 Sept–1 Oct 2026
MediaLabs Research · in collaboration with Coherence Limited
Key findings
- 019%revenue-weighted median affiliate commission across top-selling products
- 0275%of top-product revenue comes from products paying 5–15% commission (44.0% plus 31.2%)
- 031.52×revenue per product at 20–30% commission, versus 0.85× under 5%
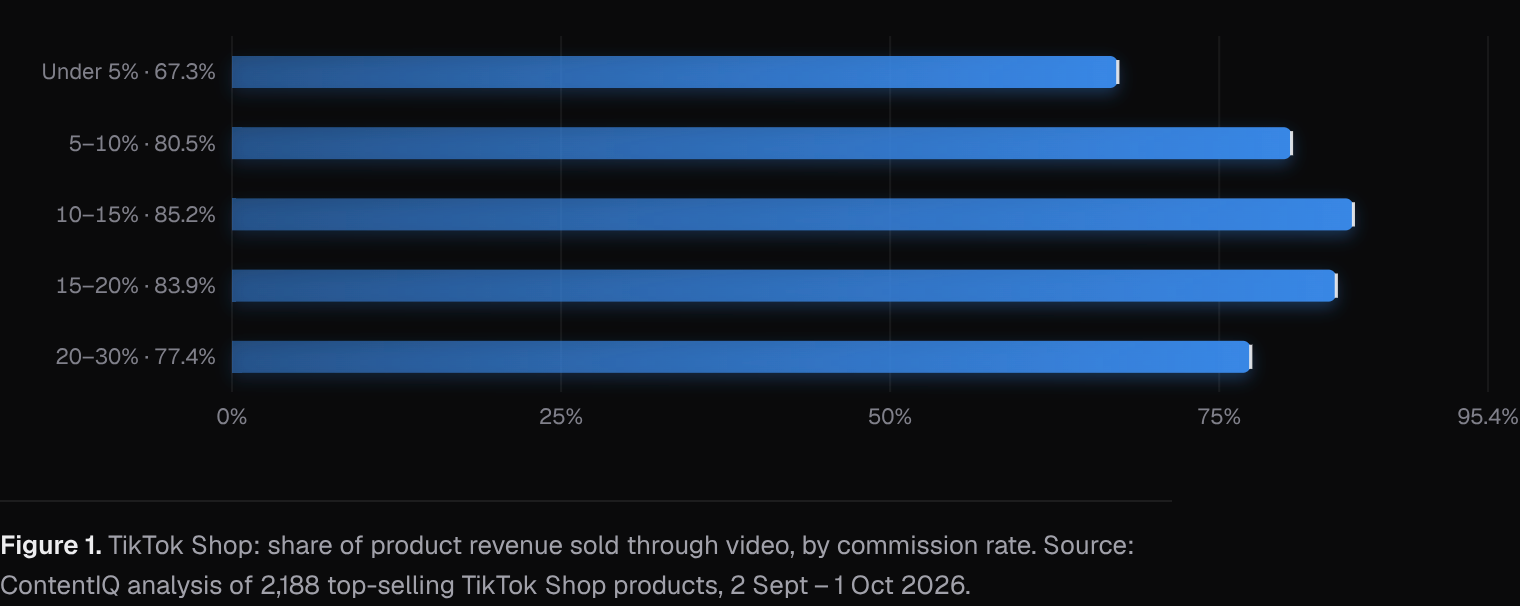
- 0485.2%of revenue sold through video at 10–15% commission, versus 67.3% under 5%
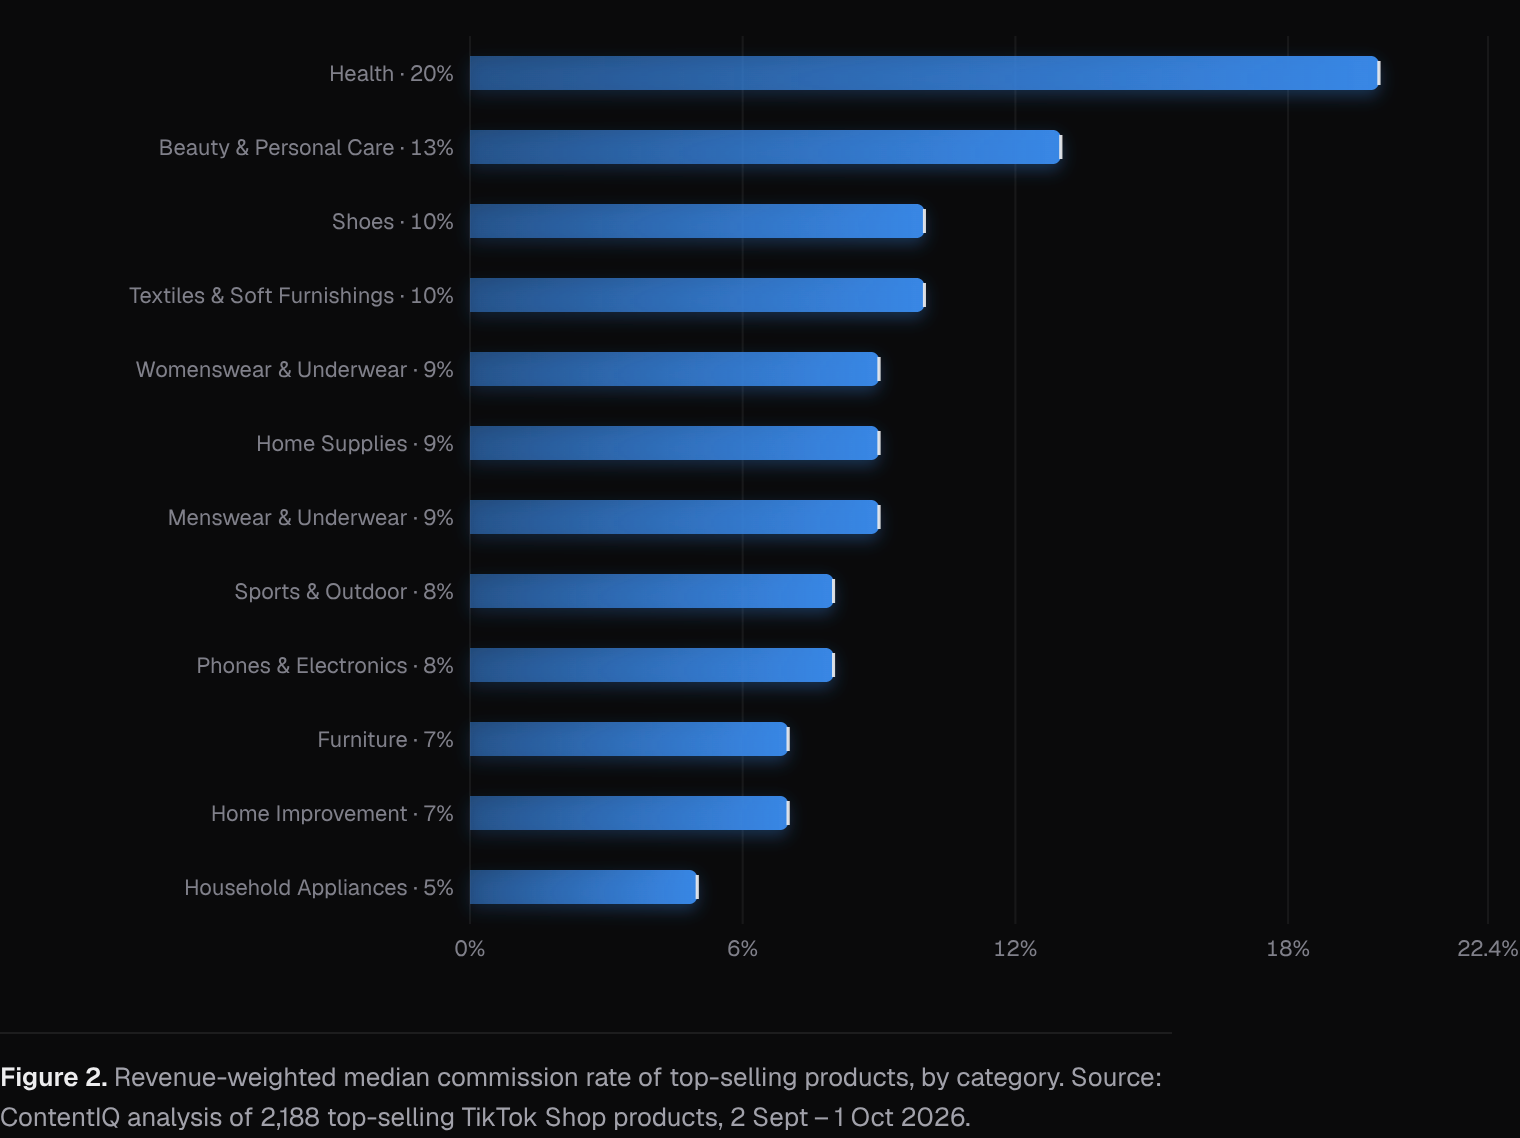
- 0520% vs 4%median commission in Health versus Fashion Accessories, the widest category gap
Contents
Abstract
We examine affiliate commission rates on 2,188 top-selling TikTok Shop products and ask whether higher commission is associated with more video-driven sales. The revenue-weighted median commission rate is 9%, and three-quarters of top-product revenue sits in the 5–15% range. Revenue per product rises with commission, from 0.85× the average product under 5% to 1.52× at 20–30%. The share of revenue sold through video peaks at 85.2% in the 10–15% band and is lowest, at 67.3%, under 5%. These are associations in one 30-day window, not evidence that raising commission causes sales.
1. Introduction
Affiliate commission is the main lever brands use to attract creators who sell on TikTok Shop. A brand that sets the rate too low may struggle to attract creators, and one that sets it too high gives away margin. The economics of referral fees suggest that rates vary with product margins and with how much effort a referral takes [1]. Brands and creators therefore need to know what rates top sellers actually pay, and whether higher rates go with more sales driven by video.
This paper describes commission rates on top-selling products, how revenue is spread across commission bands, and how the share of revenue sold through video differs by band and by category. Returns to marketing spend are hard to measure from observational data [2], so we report associations only and do not claim that raising commission raises sales.
2. Data
The data cover the 30 days from 2 September to 1 October 2026. The marketplace figures rest on 2,188 top-selling products across 29 categories. For each product we recorded the affiliate commission rate, its revenue, and the share of that revenue sold through video.
This analysis works at product level, so no individual videos were tracked or analysed in depth, and we report no video-level sales-per-view index. Category medians are reported for 25 categories, with 69 to 95 products each.
Weekly category figures for the US (estimated revenue, its split between video, LIVE and the shop tab, affiliate revenue, shops and active products, and a year of weekly revenue) and daily rankings of each category’s top-selling products (unit price, commission rate, launch date and revenue by channel) were collected from several independent sources. Medians of price and commission are weighted by revenue; momentum compares the latest weeks with the same number of weeks before. This paper covers 2026-09-02 to 2026-10-01: 2,188 top-selling products across 29 categories.
3. Methods
Commission rates are the affiliate commission rates of the same products. Each product was placed in a band: under 5%, 5–10%, 10–15%, 15–20%, 20–30%, and 30% and over. For each band we computed the number of products, the band's share of total top-product revenue, and the share of that band's revenue sold through video.
Revenue per product is each band's average revenue per product relative to the average across all 2,188 products, so 1 is the average product. The headline commission figure and the category figures are revenue-weighted medians, so products with more revenue count for more. We report no confidence ranges for these descriptive statistics, and no model was fitted.
4. Results: where the revenue sits by commission band
The revenue-weighted median commission rate is 9%. The 5–10% band holds the most products (1,052) and 44.0% of revenue, and the 10–15% band holds 643 products and 31.2%. Together they account for about three-quarters of top-product revenue. Under 5% there are 203 products (7.9% of revenue); at 15–20% there are 197 (10.7%); at 20–30% there are 89 (6.2%).
Revenue per product rises with commission through most of the range: 0.85× under 5%, 0.91× at 5–10%, 1.06× at 10–15%, 1.19× at 15–20% and 1.52× at 20–30%. The 30% and over band has only 4 products (0.1% of revenue) and 0.72×, which is too thin to interpret.
| Band | Products (n) | Share of revenue | Revenue per product vs average |
|---|---|---|---|
| Under 5% | 203 | 7.9% | 0.85× |
| 5–10% | 1,052 | 44% | 0.91× |
| 10–15% | 643 | 31.2% | 1.06× |
| 15–20% | 197 | 10.7% | 1.19× |
| 20–30% | 89 | 6.2% | 1.52× |
| 30% and over | 4 | 0.1% | 0.72× |
Note. Among the top-selling products we track in the latest week; revenue per product is against the average product in the same set (1.00 = average).
5. Results: video share of revenue by commission band
The share of product revenue sold through video is 67.3% under 5% commission and 80.5% at 5–10%. It peaks at 85.2% at 10–15% and is 83.9% at 15–20%. It then falls to 77.4% at 20–30% and 70.1% in the four-product top band.
Higher commission is therefore associated with a higher video share up to about 15–20%, but the relationship does not keep rising. The highest-commission products earn the most per product (1.52×) yet are not the most video-reliant, so some of their revenue may come through other routes.
6. Results: commission rates differ widely by category
Median commission varies more across categories than across the market. Health is highest at 20%, followed by Food & Beverages at 14%, Beauty & Personal Care at 13%, Books, Magazines & Audio at 12% and Kitchenware at 11%. Shoes, Textiles & Soft Furnishings and Jewelry Accessories & Derivatives sit at 10%.
The lowest medians are Fashion Accessories at 4%, Household Appliances and Tools & Hardware at 5%, and Computers & Office Equipment at 6%. Furniture and Home Improvement are at 7%. Because rates depend on category, the market-wide band comparisons above partly reflect which categories sit in each band.
7. Discussion
For brands, the evidence suggests that most top sellers pay between 5% and 15%, so a rate in that range is typical rather than generous. Products paying 15% or more earn more per product, but this may reflect margin, product type or category, not the rate itself. Category norms look like a sensible benchmark: a 10% rate is mid-range for Shoes but high for Household Appliances.
For creators, rates under 5% go with the lowest video share (67.3%), while products at 10–20% are the most video-reliant, at 83.9% to 85.2%. That may make them the more natural fit for video-led selling. This fits the idea that commission is set to reflect margins and the effort of a referral [1].
Several alternative explanations apply. Higher-priced or higher-margin products may both pay more commission and earn more per product. Brands may raise commission on products that already sell well, which would reverse the direction of the link. Category mix may drive the pattern. These are observational associations [2].
8. Conclusion
Top-selling TikTok Shop products pay a revenue-weighted median commission of 9%, with about three-quarters of revenue in the 5–15% range. Higher commission bands are associated with more revenue per product (up to 1.52× at 20–30%) and, up to 15–20%, with a higher share of revenue sold through video. Commission norms differ sharply by category, from 4% to 20%.
These findings describe one 30-day window of top sellers and should be read as benchmarks, not as proof that higher commission drives sales.
Methodology
Weekly category figures for the US (estimated revenue, its split between video, LIVE and the shop tab, affiliate revenue, shops and active products, and a year of weekly revenue) and daily rankings of each category’s top-selling products (unit price, commission rate, launch date and revenue by channel) were collected from several independent sources. Medians of price and commission are weighted by revenue; momentum compares the latest weeks with the same number of weeks before. This paper covers 2026-09-02 to 2026-10-01: 2,188 top-selling products across 29 categories.
Limitations
Product figures cover the top-selling products we track in each category, not every listing, so they describe what sells best rather than everything on sale. Results are associations, not causes. Paid promotion, creator audience size and product price are not fully controlled for. Revenue, views and sales are estimates, not figures reported by TikTok. The analysis covers only top-selling products, so it says nothing about products that sold little at any commission rate. It covers a single 30-day window, and no confidence ranges are available for the band or category figures. The 30% and over band has only 4 products and should not be interpreted. Each product has one commission rate, so rate changes during the window are not captured. Video-level analysis was not part of this sample.
References
- [1]Libai, B., Biyalogorsky, E., & Gerstner, E. (2003). Setting referral fees in affiliate marketing. Journal of Service Research, 5(4), 303–315.
- [2]Lewis, R. A., & Rao, J. M. (2015). The unfavorable economics of measuring the returns to advertising. The Quarterly Journal of Economics, 130(4), 1941–1973.
Cite as
MediaLabs Research, in collaboration with Coherence Limited (2026). Higher affiliate commission goes with more revenue per top-selling product on TikTok Shop, but the pattern has limits. ContentIQ Working Paper CIQ-WP-2026-11, version 1. https://medialabs-co.com/research/tiktok-shop-commission
Analysis and data: Coherence Research, Coherence ContentIQ. Published by MediaLabs in collaboration with Coherence Limited.
Version history
- Version 11 Oct 2026This version