ContentIQ working paperCIQ-WP-2026-14TikTok ShopVersion 11 Oct 2026
Which TikTok Shop categories sold above a normal month around the coming US retail moments
29 categories covered, 2 Sept–1 Oct 2026
MediaLabs Research · in collaboration with Coherence Limited
Key findings
- 011.54×Pre-Owned sales in the Black Friday and holiday months last year, against a normal month
- 020.83×Household Appliances in the same months, the lowest of the categories shown
- 031.33×Pre-Owned in January, the highest New Year index, ahead of Kitchenware at 1.17×
- 040.70×Baby & Maternity in January, the lowest New Year index
- 050.93 and 1.03Whole-market index for November and December 2025, so the market overall was close to normal
- 0640 daysUntil the Black Friday / Cyber Monday window opens on 10 November
Contents
Abstract
We examine three US retail moments in the next four months, Black Friday / Cyber Monday, holiday gifting and New Year resolutions, and which TikTok Shop categories sold above their normal month in the same months last year. Pre-Owned sold at 1.54× a normal month across November and December and 1.33× in January, while Household Appliances sold at 0.83× in November–December and Baby & Maternity at 0.70× in January. The market as a whole was close to normal in November and December 2025 (0.93 and 1.03), so the differences between categories matter more than the overall level. The evidence covers one year, has no uncertainty ranges, and gives no category comparison for Halloween, so it should guide planning rather than set targets.
1. Introduction
Brands and creators on TikTok Shop must decide months ahead which products to stock and which content to prepare. Retail moments such as Black Friday, holiday gifting and the New Year are natural planning anchors, but they do not lift every category equally. A category can sell far above its normal month while another sells below it.
Our question is narrow: for the US retail moments in the next four months, which categories sold above or below their normal month in the same calendar months last year? Seasonal patterns are usually separated from trend before they are read, as in seasonal-trend decomposition [1]. We use a simpler comparison against each category's average month, described under Methods.
This is descriptive work. We report what sold when, not why, and we do not claim that a retail moment caused any difference.
2. Data
The analysis covers TikTok Shop across 29 categories, with a window running from 2 September to 1 October 2026. The seasonal comparisons use revenue by category and month, and the evidence rests on 28 categories. No video counts are reported for this edition, so the analysis does not draw on video-level analysis.
Four retail moments are tracked: Halloween (25 September to 31 October), Black Friday / Cyber Monday (10 November to 2 December), holiday gifting (15 November to 24 December) and New Year resolutions (1 to 31 January 2027). Each is linked to the calendar months it spans. Halloween is already under way, and the evidence lists no categories above or below normal for it.
Weekly category figures for the US (estimated revenue, its split between video, LIVE and the shop tab, affiliate revenue, shops and active products, and a year of weekly revenue) and daily rankings of each category’s top-selling products (unit price, commission rate, launch date and revenue by channel) were collected from several independent sources. Medians of price and commission are weighted by revenue; momentum compares the latest weeks with the same number of weeks before. This paper covers 2026-09-02 to 2026-10-01.
3. Methods
For each category and month, we compared revenue with that category's average month over the past year, so a value of 1 is a normal month, 1.2 is 20% above and 0.8 is 20% below. The partial first and last months were left out. Separating seasonal patterns from trend follows the logic of [1].
For each retail moment, a category's index is its value for the calendar months the moment spans in the previous year. Black Friday / Cyber Monday and holiday gifting span the same two months, November and December, so they share the same category values. We cannot separate the two moments, or the weeks within a month.
The same method gives a whole-market index by month. No uncertainty ranges are available for these indices.
4. Results: the moments and the categories furthest above normal
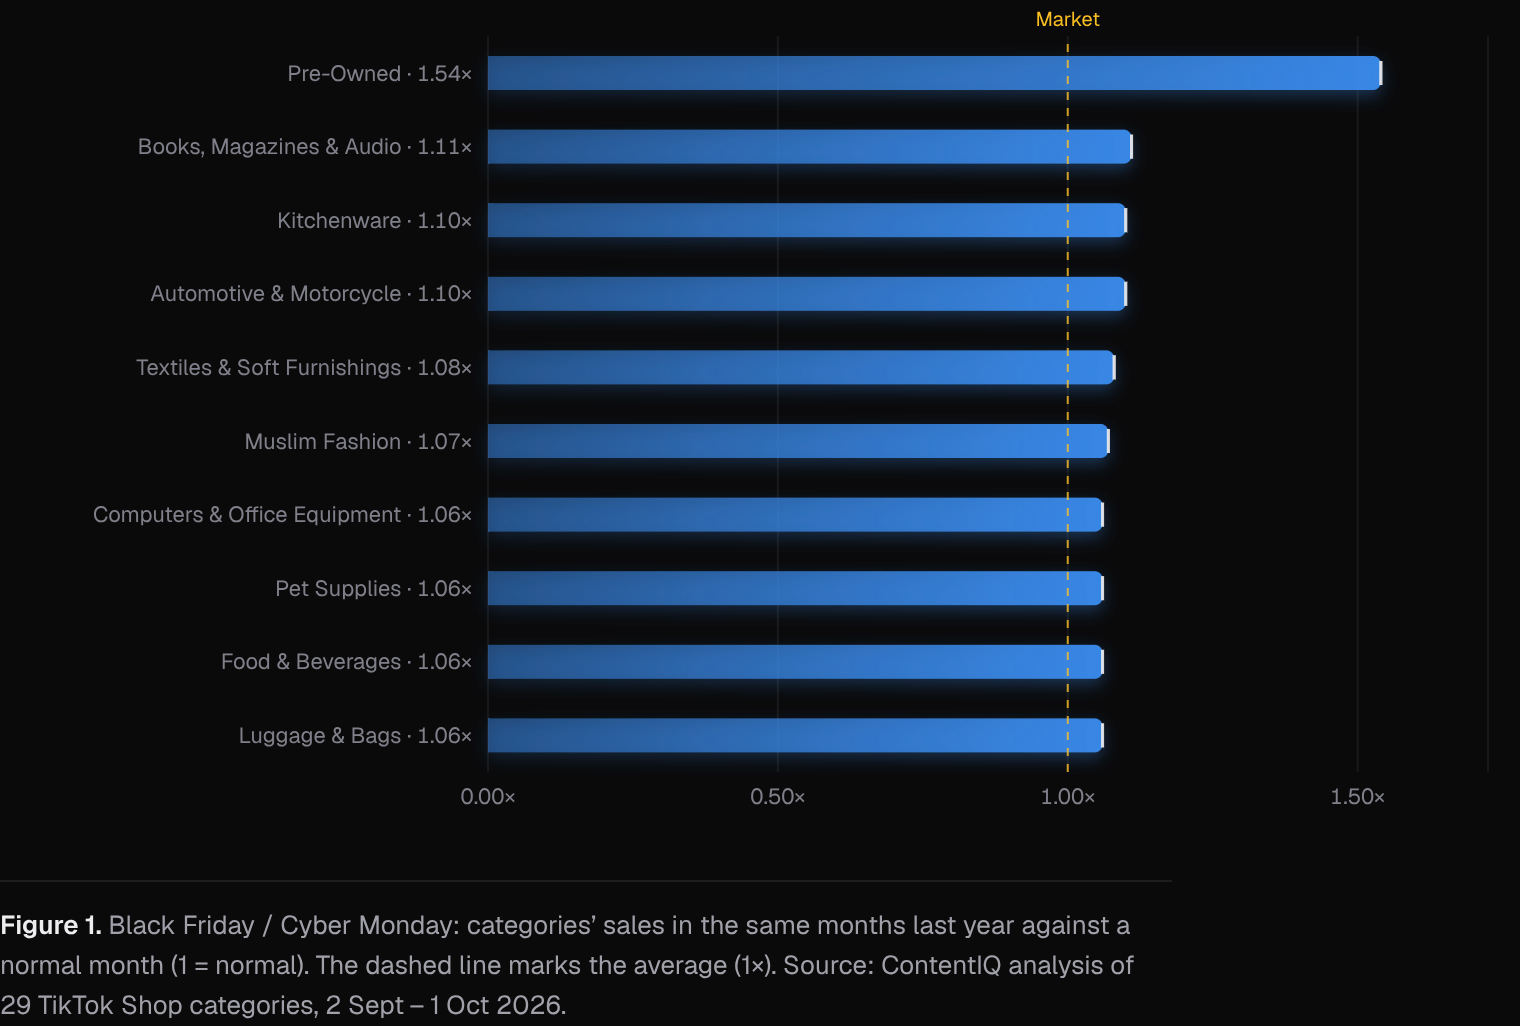
Pre-Owned sold furthest above a normal month in both windows: 1.54× across November and December and 1.33× in January. Pre-Owned is the only category above 1.2× in either window apart from Kitchenware in January (1.17×), and several of the others are only slightly above normal.
In November and December, the next highest were Books, Magazines & Audio (1.11×), Kitchenware (1.10×) and Automotive & Motorcycle (1.10×). In January, Kitchenware (1.17×) and Furniture (1.13×) followed Pre-Owned.
The table gives the exact figures. Because the indices come from a single year and carry no ranges, differences of a few percentage points between neighbouring categories should not be read as a ranking.
| Moment | Dates | Starts in | Categories furthest above normal |
|---|---|---|---|
| Halloween | 25 Sept–31 Oct | On now | |
| Black Friday / Cyber Monday | 10 Nov–2 Dec | 40 days | Pre-Owned (1.54×), Books, Magazines & Audio (1.11×), Kitchenware (1.10×) |
| Holiday gifting | 15 Nov–24 Dec | 45 days | Pre-Owned (1.54×), Books, Magazines & Audio (1.11×), Kitchenware (1.10×) |
| New Year resolutions | 1 Jan–31 Jan | 92 days | Pre-Owned (1.33×), Kitchenware (1.17×), Furniture (1.13×) |
Note. Each category’s months are compared with its own average month over the past year; the first and last (partial) months are left out.
5. Results: Black Friday and holiday months, above and below normal
Across the Black Friday and holiday months, ten categories sold above normal, but only Pre-Owned did so by a wide margin. Computers & Office Equipment, Pet Supplies, Food & Beverages and Luggage & Bags each sat at 1.06×.
Five categories sold below normal in the same months: Womenswear & Underwear, Baby & Maternity, Toys & Hobbies and Tools & Hardware at 0.90×, and Household Appliances at 0.83×. Toys & Hobbies below normal in the gifting period may be surprising, and may reflect how a category's normal month is set or when its demand peaks within the year. The data cannot say which.
In January, Sports & Outdoor (0.80×), Automotive & Motorcycle (0.78×), Textiles & Soft Furnishings (0.77×), Computers & Office Equipment (0.76×) and Baby & Maternity (0.70×) were the weakest. Several of these were above normal in November and December, consistent with demand being pulled forward into the holiday months.
6. Results: the market as a whole
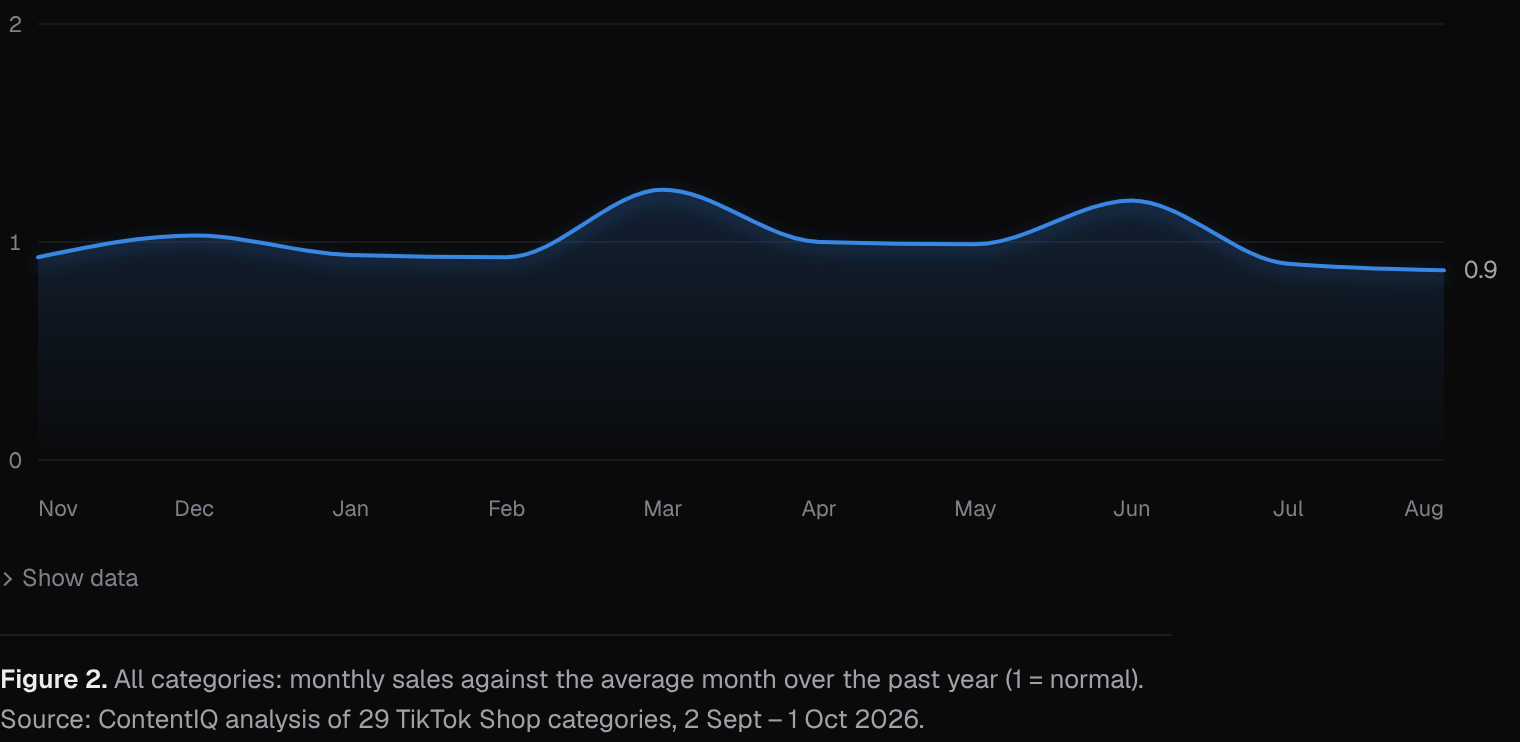
At market level, the index for November 2025 was 0.93 and for December 2025 1.03, so neither month was far from normal. The peaks of the past year came in March 2026 (1.24) and June 2026 (1.19). January and February 2026 were both below normal (0.94 and 0.93).
July and August 2026 were 0.90 and 0.87, the lowest recent months. Since the index is relative to the past year's average month, these figures also reflect any trend over that year, which this simple comparison does not remove.
The market-level pattern suggests that a category's index in November and December largely reflects its own seasonality rather than a general holiday lift.
7. Discussion
For brands, the evidence points to differences between categories rather than a shared holiday lift. Categories above normal in November and December, such as Kitchenware and Pet Supplies, may justify earlier stock and creative preparation, while Household Appliances and Baby & Maternity sold below normal in those months and then (for Baby & Maternity) in January too. Kitchenware was above normal in both windows, at 1.10× and 1.17×.
For creators, the table can guide which categories to feature in the coming weeks, but it says nothing about which videos or formats work. Seasonal sales also say nothing about the return on any one piece of content, which is hard to measure from observational data [2].
There are alternative explanations. Last year's pattern may have been shaped by promotions, supply, shifting category composition or a one-off event, and Pre-Owned's high index may reflect a small base. The month-level index also cannot separate Black Friday week from the rest of November.
8. Conclusion
Last year, TikTok Shop categories did not move together around the holiday and New Year windows. Pre-Owned led in both (1.54× in November–December and 1.33× in January), a handful of categories sat modestly above normal, and others, led by Household Appliances and Baby & Maternity, fell below it.
Planners should treat these indices as a starting point, to be checked against current stock, pricing and promotion plans. With one year of data and no ranges, they describe association and are not forecasts.
Methodology
Weekly category figures for the US (estimated revenue, its split between video, LIVE and the shop tab, affiliate revenue, shops and active products, and a year of weekly revenue) and daily rankings of each category’s top-selling products (unit price, commission rate, launch date and revenue by channel) were collected from several independent sources. Medians of price and commission are weighted by revenue; momentum compares the latest weeks with the same number of weeks before. This paper covers 2026-09-02 to 2026-10-01.
Limitations
Product figures cover the top-selling products we track in each category, not every listing, so they describe what sells best rather than everything on sale. Results are associations, not causes. Paid promotion, creator audience size and product price are not fully controlled for. Revenue, views and sales are estimates, not figures reported by TikTok. The seasonal indices rest on a single year of history and carry no uncertainty ranges. Black Friday / Cyber Monday and holiday gifting share the same two calendar months and so share the same figures. Halloween has no category comparison in the evidence. This edition has no tracked or analysed video counts, so it says nothing about content. The index is relative to the past year's average month, so trend can influence it.
References
- [1]Cleveland, R. B., Cleveland, W. S., McRae, J. E., & Terpenning, I. (1990). STL: A seasonal-trend decomposition procedure based on loess. Journal of Official Statistics, 6(1), 3–73.
- [2]Lewis, R. A., & Rao, J. M. (2015). The unfavorable economics of measuring the returns to advertising. The Quarterly Journal of Economics, 130(4), 1941–1973.
Cite as
MediaLabs Research, in collaboration with Coherence Limited (2026). Which TikTok Shop categories sold above a normal month around the coming US retail moments. ContentIQ Working Paper CIQ-WP-2026-14, version 1. https://medialabs-co.com/research/tiktok-shop-seasonal-moments
Analysis and data: Coherence Research, Coherence ContentIQ. Published by MediaLabs in collaboration with Coherence Limited.
Version history
- Version 11 Oct 2026This version