ContentIQ working paperCIQ-WP-2026-12TikTok ShopVersion 11 Oct 2026
Newly launched products earn about a sixth of TikTok Shop top-product revenue, with large differences by category
2,800 top-selling products across 29 categories, 2 September–1 October 2026
MediaLabs Research · in collaboration with Coherence Limited
Key findings
- 0117.2%of top-product revenue comes from products launched in the last 90 days
- 0232.1%of revenue comes from products aged 1–2 years, the largest age band
- 030.76× vs 1.15×revenue per product for products under 30 days old versus those over 2 years old (1 = average)
- 0455.5%of Collectibles top-product revenue comes from products under 90 days old, the highest of the categories shown
- 053.8%of Health top-product revenue comes from products under 90 days old, the lowest of the categories shown
Contents
Abstract
We examined how top-product revenue on TikTok Shop splits between newly launched and established products. Products launched in the last 90 days account for 17.2% of top-product revenue, while products aged 1–2 years account for the largest single share, 32.1%. Newer products earn less per product than the average (0.76× for those under 30 days, 1.15× for those over 2 years). The new-product share varies widely by category, from 3.8% in Health to 55.5% in Collectibles, and these are associations from a one-month window.
1. Introduction
Brands deciding what to launch, and creators deciding what to promote, face a basic question: is TikTok Shop a place where new products can break through, or do established products take most of the revenue? The answer shapes whether a launch is worth the investment and whether a creator should look for the next arrival or back a proven seller.
Online retail is known for selling a long tail of products beyond the bestsellers [1], which suggests room for newcomers. But observational sales data cannot easily show what causes any one product to succeed [2], so we describe patterns rather than explain them.
This paper asks how top-product revenue divides by product age, and in which categories newly launched products hold the largest share.
2. Data
The analysis covers the top-selling products on TikTok Shop between 2 September and 1 October 2026: 2,800 products across 29 categories. The marketplace figures rest on these products only, so they describe the top of the market and not every listing.
For each product we recorded its launch date and its revenue in the latest week. The category breakdown shows 25 categories with 100 products each. This sample has no video component, so no videos are tracked or analysed in depth here.
Weekly category figures for the US (estimated revenue, its split between video, LIVE and the shop tab, affiliate revenue, shops and active products, and a year of weekly revenue) and daily rankings of each category’s top-selling products (unit price, commission rate, launch date and revenue by channel) were collected from several independent sources. Medians of price and commission are weighted by revenue; momentum compares the latest weeks with the same number of weeks before. This paper covers 2026-09-02 to 2026-10-01: 2,800 top-selling products across 29 categories.
3. Methods
Product age is the number of days from a product’s launch to the latest week, grouped into six bands: under 30 days, 30–90 days, 3–6 months, 6–12 months, 1–2 years and over 2 years.
For each band we report the number of products, the share of top-product revenue, and revenue per product relative to the average product (1 = the average). The headline measure is the share of top-product revenue from products launched in the last 90 days, also computed within each category.
No confidence ranges were produced for these figures, so none are reported.
4. Results: revenue by product age
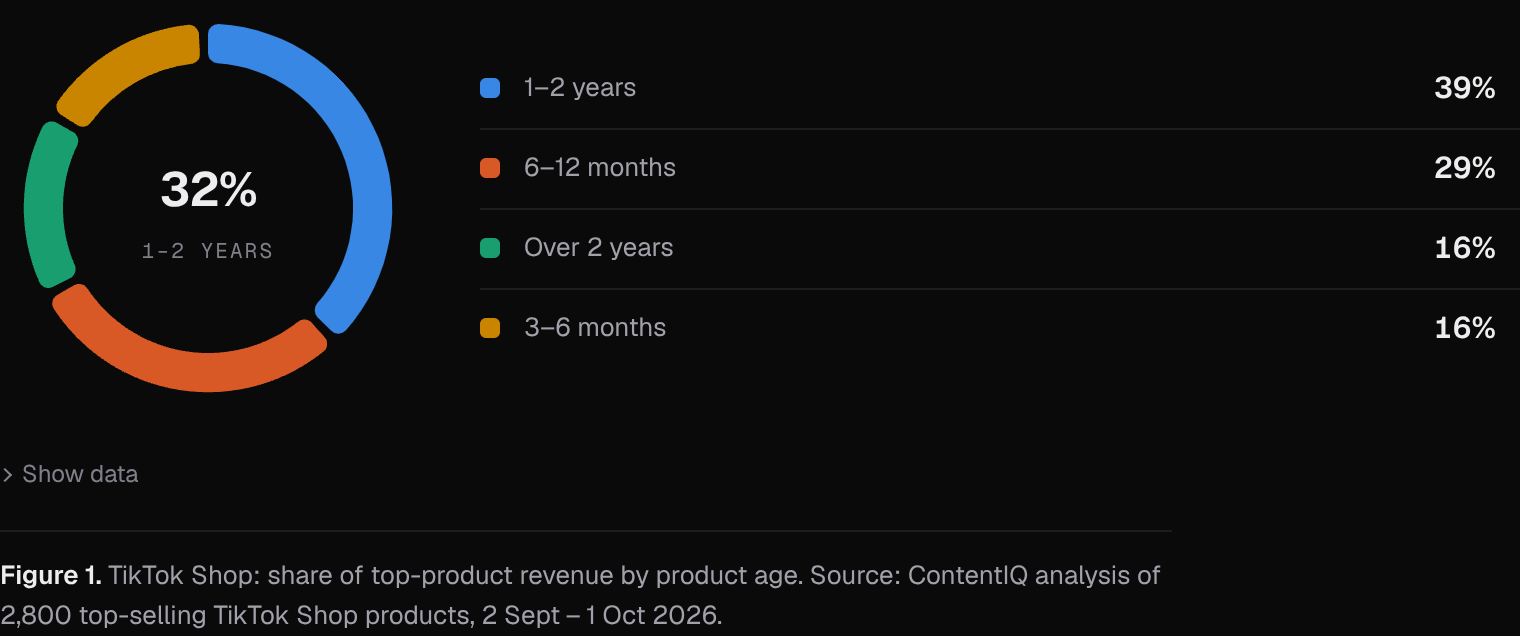
Products under 30 days old (280 products) account for 7.6% of top-product revenue, and products aged 30–90 days (296 products) for 9.5%. Together, products launched in the last 90 days bring in 17.2% of revenue.
Most revenue sits with older products. Those aged 6–12 months account for 24.3%, those aged 1–2 years for 32.1% (832 products), and those over 2 years for 13.4%. Products aged 3–6 months account for 13%.
5. Results: revenue per product
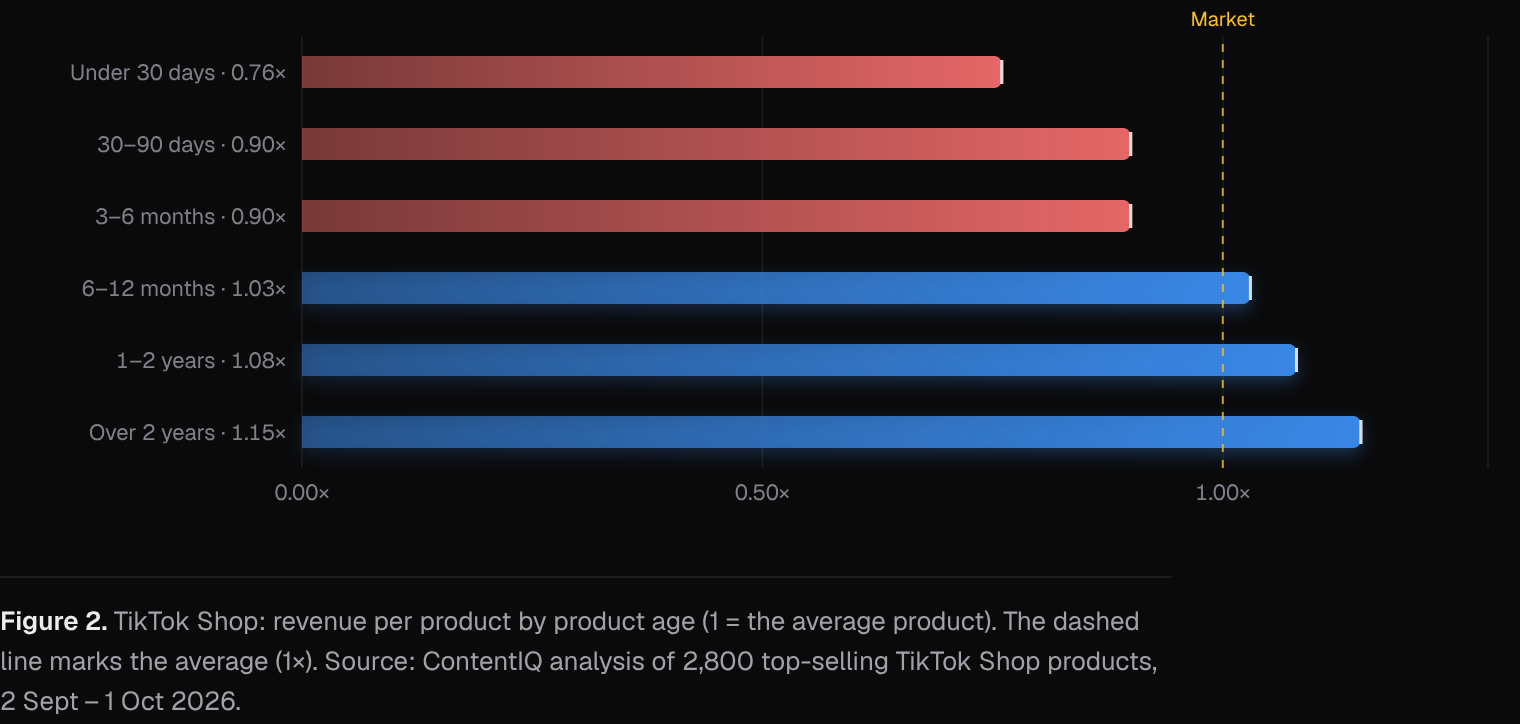
Revenue per product rises with age in this sample. Products under 30 days old earn 0.76× the average product, those aged 30–90 days and 3–6 months earn 0.9×, those aged 6–12 months earn 1.03×, those aged 1–2 years earn 1.08×, and those over 2 years earn 1.15×.
So newer products are typically behind established ones in revenue per product, though the gap is moderate and the newest products are still present in the top-seller list in meaningful numbers. Newer products may also have had less time to build sales, so this should not be read as a verdict on their quality.
6. Results: where newcomers break through
The share of top-product revenue from products under 90 days old differs sharply by category. Collectibles is highest at 55.5%, followed by Toys & Hobbies at 36.1%, Phones & Electronics at 30.8% and Household Appliances at 30.6%.
At the other end, Health (3.8%), Furniture (4.2%), Home Improvement (4.2%) and Baby & Maternity (6.6%) draw little revenue from new launches. Pet Supplies (8%) and Fashion Accessories (8.7%) are also low. Most remaining categories fall between 12.5% and 24%.
Each category rests on 100 products, so individual category shares are based on thin samples and could move with a few large sellers.
7. Discussion
For brands, the evidence suggests that new launches face very different odds by category. In Collectibles, Toys & Hobbies and some electronics and appliance categories, newer products hold a large share of top revenue, which is consistent with fast-moving, trend- or release-driven demand. In Health, Furniture and Home Improvement, established products hold most of the revenue, and a newcomer may need to displace proven sellers.
For creators, the overall pattern suggests that backing established products is the larger pool of revenue, while newer products are a smaller but real share, especially in the categories above. These are associations, not causes: category differences may reflect product life cycles, purchase frequency or trust requirements rather than anything about TikTok Shop itself.
Alternative explanations include seasonality, which a one-month window cannot separate from trend [3], and the way launch dates are recorded. A product relaunched or relisted could appear newer than it is.
8. Conclusion
Products launched in the last 90 days account for 17.2% of top-product revenue in our analysis of TikTok Shop, and established products aged 1–2 years account for the largest share at 32.1%. Newer products earn less per product than the average, but the share they hold varies from 3.8% in Health to 55.5% in Collectibles.
The findings come from a single 30-day window and 100 products per category, so they should be treated as a snapshot to be re-tested over time.
Methodology
Weekly category figures for the US (estimated revenue, its split between video, LIVE and the shop tab, affiliate revenue, shops and active products, and a year of weekly revenue) and daily rankings of each category’s top-selling products (unit price, commission rate, launch date and revenue by channel) were collected from several independent sources. Medians of price and commission are weighted by revenue; momentum compares the latest weeks with the same number of weeks before. This paper covers 2026-09-02 to 2026-10-01: 2,800 top-selling products across 29 categories.
Limitations
Product figures cover the top-selling products we track in each category, not every listing, so they describe what sells best rather than everything on sale. Results are associations, not causes. Paid promotion, creator audience size and product price are not fully controlled for. Revenue, views and sales are estimates, not figures reported by TikTok. The window is one month, so seasonal effects and launch timing cannot be separated from lasting patterns. The sample covers top-selling products only, so it says nothing about newer products that did not reach the top. The category chart shows 25 categories of 100 products each, although 29 categories are covered overall. No confidence ranges are available for the age or category shares.
References
- [1]Brynjolfsson, E., Hu, Y. J., & Smith, M. D. (2003). Consumer surplus in the digital economy: Estimating the value of increased product variety at online booksellers. Management Science, 49(11), 1580–1596.
- [2]Lewis, R. A., & Rao, J. M. (2015). The unfavorable economics of measuring the returns to advertising. The Quarterly Journal of Economics, 130(4), 1941–1973.
- [3]Cleveland, R. B., Cleveland, W. S., McRae, J. E., & Terpenning, I. (1990). STL: A seasonal-trend decomposition procedure based on loess. Journal of Official Statistics, 6(1), 3–73.
Cite as
MediaLabs Research, in collaboration with Coherence Limited (2026). Newly launched products earn about a sixth of TikTok Shop top-product revenue, with large differences by category. ContentIQ Working Paper CIQ-WP-2026-12, version 1. https://medialabs-co.com/research/tiktok-shop-new-products
Analysis and data: Coherence Research, Coherence ContentIQ. Published by MediaLabs in collaboration with Coherence Limited.
Version history
- Version 11 Oct 2026This version