ContentIQ working paperCIQ-WP-2026-66CreativeVersion 118 Oct 2026
The first frame of a UGC video: what to show
51,843 videos tracked, 9,285 analysed in depth, 29 categories, 19 Sept–18 Oct 2026
MediaLabs Research · in collaboration with Coherence Limited
Key findings
- 011.07sales per view when face, text and product all appear in the first second (90% range 1.03–1.10; 1 = market average)
- 020.92sales per view when only one of the three appears (90% range 0.88–0.96)
- 031.03 vs 0.90sales per view with the product on screen in the first second versus without (ranges 1.01–1.05 and 0.86–0.94)
- 041.04 vs 0.93sales per view with a face in the first second versus without (ranges 1.02–1.07 and 0.91–0.96)
- 050.99 vs 1.03sales per view with on-screen text versus without; the ranges (0.97–1.01 and 0.99–1.06) overlap, so no clear difference
Contents
Abstract
What should a UGC video show in its first second? In our analysis of US TikTok Shop, videos that showed a face, on-screen text and the product together sold at 1.07 times the market average sales per view (90% range 1.03–1.10), against 0.92 (0.88–0.96) for videos showing only one of the three. Product visibility showed the largest single gap (1.03 with the product on screen, 0.90 without), face showed a smaller one, and text showed no clear difference. These are associations in observational data on first-second presence, not frame-level attention or watch time, so the checklist we propose is a recommendation to test, not a finding.
1. Introduction
Short answer: in this US TikTok Shop sample, the first-second combination associated with the highest sales per view was a face, on-screen text and the product together (1.07, 90% range 1.03–1.10, where 1 is the market average). Of the three elements taken singly, the product being visible showed the largest gap, a face a smaller one, and text no clear difference. If you are briefing a creator this quarter, the evidence supports treating the opening second as a place to show the product and a person, and testing text rather than assuming it helps.
The question matters because a first frame is a part of a video that a brand can specify in a brief. Prior work shows that early popularity predicts later popularity and that online attention is long-tailed [1]. Research on short-video popularity prediction finds that creator features matter most [2], with multimodal content features adding to them [3]. So the first frame is likely one factor among many, not a lever that works alone.
This paper asks a narrow question: do videos that show a face, text or the product in the first second sell at different rates per view from those that do not? We measure first-second presence only, not exact frame-level attention or watch time. The data are US TikTok Shop observations, not all UGC everywhere.
2. Data
Our analysis covers US TikTok Shop from 19 September to 18 October 2026. We tracked 51,843 videos across 29 categories, and our AI analyst watched and analysed 9,285 of them in depth. Watched means analysed, not a count of views.
For each analysed video the analyst recorded whether a face, on-screen text and the product were present in the first second. The first-second groups in the tables below sum to 7,578 videos. Shares of sales are shares of watched-video sales.
The record is binary presence in the first second. It does not capture how long an element stayed on screen, how prominent it was, or whether viewers watched past the opening.
Daily rankings of top-selling TikTok Shop videos in the US were collected from several independent sources and merged into one record per video. Where sources overlap, their sales estimates are cross-checked against each other, and videos whose estimates disagree by more than half are flagged. An AI analyst watched each video and recorded its opening, format, angle, production style, use of AI, hook source, length, pacing, what appears in the first second and how it is presented (people on screen, voice-over, setting, UGC or studio feel), without seeing how the video sold. Sales per view is a video group’s revenue per view divided by the market’s, shrunk toward the average for small groups, with 90% ranges. This paper covers 2026-09-19 to 2026-10-18: 51,843 videos tracked, 9,285 of them watched and analysed.
3. Methods
Sales per view compares a group of videos with the market. It is the group's revenue per view divided by the market's revenue per view, so 1 is the market average and 1.07 means 7% more revenue per view than average. Estimates for small groups are shrunk toward the average by empirical Bayes [4], and we report 90% intervals computed on the log scale.
We split videos three ways: by whether a face, text or the product appeared in the first second, and by how many of the three appeared (none, one, two or all three). Share of sales is the group's portion of watched-video sales.
We use no causal design. Groups are not matched on creator, category, price or paid promotion, so every contrast is an association. Intervals describe uncertainty within groups; overlap alone is not a formal test of differences between groups.
4. Results: face, text and product, one at a time
Showing the product in the first second was the clearest single contrast. Videos with the product on screen (6,358 videos, 81.6% of sales) sold at 1.03 sales per view (90% range 1.01–1.05). Videos without it (1,220 videos, 18.4% of sales) sold at 0.90 (0.86–0.94). The ranges do not overlap.
A face showed a smaller gap in the same direction. With a face, sales per view were 1.04 (1.02–1.07) across 4,456 videos and 63.5% of sales. Without a face they were 0.93 (0.91–0.96) across 3,122 videos and 36.5% of sales.
Text showed no clear difference. Videos with text (5,144 videos, 69.1% of sales) sold at 0.99 (0.97–1.01), and videos without it (2,434 videos, 30.9% of sales) at 1.03 (0.99–1.06). The ranges overlap. Text was common, and its presence alone does not separate stronger videos from weaker ones here.
| In the first second | Videos (n) | Share of sales | Sales per view | 90% range |
|---|---|---|---|---|
| Face in the first second: yes | 4,456 | 63.5% | 1.04× | 1.02–1.07 |
| Face in the first second: no | 3,122 | 36.5% | 0.93× | 0.91–0.96 |
| Text on screen in the first second: yes | 5,144 | 69.1% | 0.99× | 0.97–1.01 |
| Text on screen in the first second: no | 2,434 | 30.9% | 1.03× | 0.99–1.06 |
| Product in the first second: yes | 6,358 | 81.6% | 1.03× | 1.01–1.05 |
| Product in the first second: no | 1,220 | 18.4% | 0.90× | 0.86–0.94 |
Note. Each pair splits the same videos; sales per view is relative to the market (1.00 = average), shrunk toward the average for small groups; ranges are 90% intervals.
5. Results: how many elements appear together
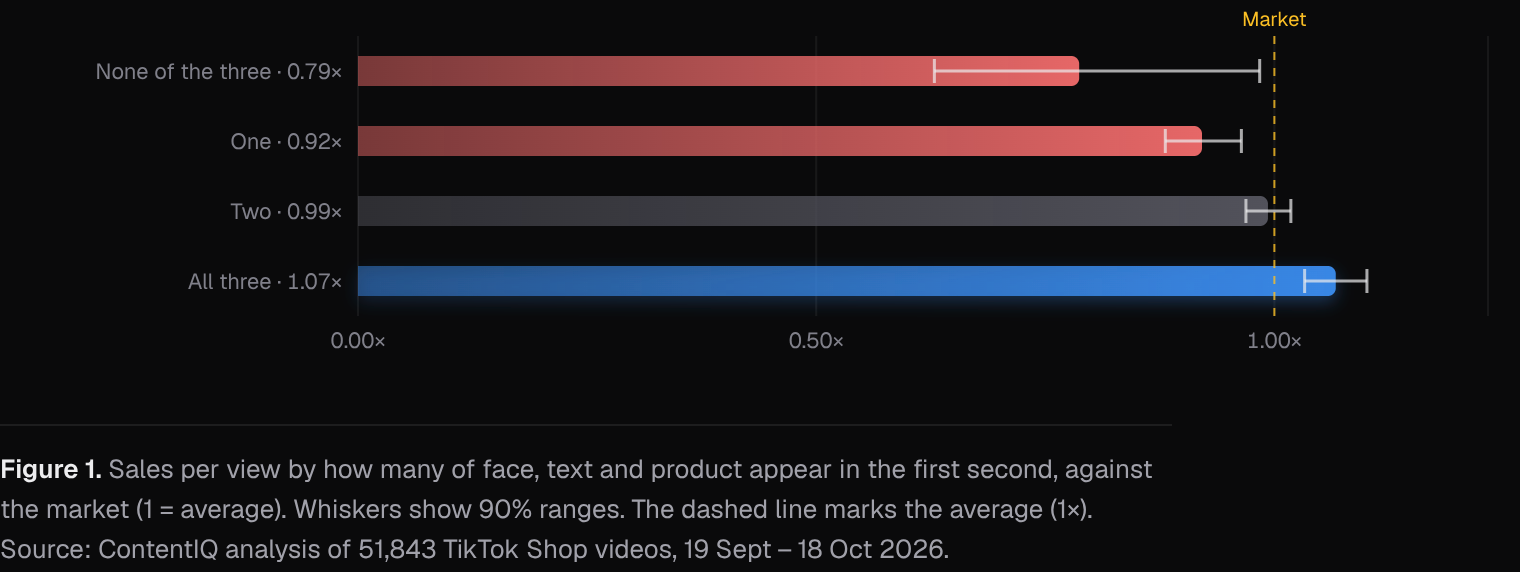
Sales per view rose with the number of elements present. Videos with all three (2,255 videos, 32.0% of sales) sold at 1.07 (1.03–1.10). Two elements gave 0.99 (0.97–1.02) across 3,921 videos and 50.9% of sales. One element gave 0.92 (0.88–0.96) across 1,351 videos and 16.4% of sales. The all-three and one-element ranges do not overlap.
Videos with none of the three were rare: 51 videos and 0.7% of sales, at 0.79 (0.63–0.98). This is a thin group, and its wide range reflects that, so we read it as consistent with the pattern but not as a precise figure.
The pattern is graded, which is what you would expect if the elements add up. It is also what you would expect if better-resourced creators tend to include all three. The data cannot separate these explanations.
6. Discussion
For brands and creators, the evidence is consistent with a simple opening: show the product and a person in the first second, and treat text as optional until you have tested it. The associations are modest. The largest is about 1.07 against 0.92, and shifts of this size can be swamped by creator, product, price and promotion. Creator features matter most in popularity prediction [2], and returns to advertising are hard to measure from observational data [5]. We therefore read these as planning hints, not effects.
Alternative explanations are plausible. Creators who show the product early may also be more experienced or better briefed. Products that are easy to show in one second may be easier to sell. Videos that show all three may be more heavily produced or more heavily promoted. Presence in the first second is also a coarse measure, since it says nothing about framing, duration or what viewers did next.
Recommendation, not a finding: a first-frame planning checklist and test plan. (1) Put the product in frame in the first second. (2) Put a face in frame, whether the creator's or a user's. (3) Treat on-screen text as a variable to test, not a default. (4) For one product, brief two or three versions of the same video that differ only in the opening second, keeping creator, script, offer and any paid promotion the same. (5) Run the versions in comparable windows, and compare sales per view and watch-through, treating a gap as meaningful only if it is larger than your run-to-run noise. (6) Keep the opening that holds up across more than one product before making it a standing brief. This plan has not been run by us, and we make no claim about the results it will give.
7. What this means for brands and founders
- Plan the product shot: in this sample, videos with the product on screen in the first second sold at 1.03 sales per view (90% range 1.01–1.05), against 0.90 (0.86–0.94) without it.
- Plan for a face in the opening: videos with a face in the first second sold at 1.04 (1.02–1.07) against 0.93 (0.91–0.96) without, so test a face-visible opening against an otherwise comparable version.
- Test text before mandating it: videos with first-second text sold at 0.99 (0.97–1.01) against 1.03 (0.99–1.06) without, and the ranges overlap, so compare versions with and without text.
- Plan for combinations: videos showing all three of face, text and product sold at 1.07 (1.03–1.10) against 0.92 (0.88–0.96) with only one, an association to test, not a promise.
8. Conclusion
In our analysis of US TikTok Shop, videos that showed the product, a face and text together in the first second sold at 1.07 sales per view (90% range 1.03–1.10), above videos showing one element (0.92, 0.88–0.96). The product was the element most clearly linked to higher sales per view, a face less so, and text not at all by itself.
The findings describe first-second presence in one market over one 30-day window, with one thin group (51 videos with none of the three). They do not show that changing the first frame raises sales. The checklist above is a proposal for brands and creators to test on their own products.
Methodology
Daily rankings of top-selling TikTok Shop videos in the US were collected from several independent sources and merged into one record per video. Where sources overlap, their sales estimates are cross-checked against each other, and videos whose estimates disagree by more than half are flagged. An AI analyst watched each video and recorded its opening, format, angle, production style, use of AI, hook source, length, pacing, what appears in the first second and how it is presented (people on screen, voice-over, setting, UGC or studio feel), without seeing how the video sold. Sales per view is a video group’s revenue per view divided by the market’s, shrunk toward the average for small groups, with 90% ranges. This paper covers 2026-09-19 to 2026-10-18: 51,843 videos tracked, 9,285 of them watched and analysed.
Limitations
Most videos in the sample are top-ranked, so findings mostly separate strong sellers from good ones rather than from all videos; typical and weak videos are being added. Results are associations, not causes. Paid promotion, creator audience size and product price are not fully controlled for. Revenue, views and sales are estimates, not figures reported by TikTok. The first-second fields are binary presence in the first second, not frame-level attention, prominence or watch time. Only 7,578 of the 9,285 videos analysed in depth appear in the first-second tables. The data are US TikTok Shop only, over a 30-day window. Groups are not matched on creator, category, price or paid promotion, so every contrast is an association and confounding is likely. The none-of-the-three group is thin (51 videos), and shrinkage and 90% ranges only partly reflect that.
References
- [1]Szabo, G., & Huberman, B. A. (2010). Predicting the popularity of online content. Communications of the ACM, 53(8), 80–88. cacm.acm.org/research/predicting-the-popularity-of-online-content
- [2]Ye, L., Zhang, Y., Wu, Y., et al. (2025). MVP: Winning solution to SMP Challenge 2025 video track. arXiv:2507.00950. arxiv.org/abs/2507.00950
- [3]Lu, J., Wang, W., Xiao, M., et al. (2024). M3TR: Temporal retrieval enhanced multi-modal micro-video popularity prediction. arXiv:2411.15455. arxiv.org/abs/2411.15455
- [4]Efron, B., & Morris, C. (1975). Data analysis using Stein’s estimator and its generalizations. Journal of the American Statistical Association, 70(350), 311–319.
- [5]Lewis, R. A., & Rao, J. M. (2015). The unfavorable economics of measuring the returns to advertising. The Quarterly Journal of Economics, 130(4), 1941–1973.
Cite as
MediaLabs Research, in collaboration with Coherence Limited (2026). The first frame of a UGC video: what to show. ContentIQ Working Paper CIQ-WP-2026-66, version 1. https://medialabs-co.com/research/ugc-first-frame
Analysis and data: Coherence Research, Coherence ContentIQ. Published by MediaLabs in collaboration with Coherence Limited.
Version history
- Version 118 Oct 2026This version