ContentIQ working paperCIQ-WP-2026-60CreativeVersion 118 Oct 2026
UGC hook testing: a framework for TikTok Shop
51,843 videos tracked, 9,285 analysed in depth, 29 categories, 19 Sept–18 Oct 2026
MediaLabs Research · in collaboration with Coherence Limited
Key findings
- 011.5×sales per view for price or deal openings (90% range 1.37–1.58), the highest of the common hook types
- 021.2×sales per view for bold-claim openings (1.19–1.29) across 1,361 videos, 17% of watched-video sales
- 030.68×sales per view for borrowed clips such as TV, film, news or viral footage (0.60–0.76)
- 0489.4%share of watched-video sales from hooks filmed for the video, at the market average (1.00×, range 0.99–1.02)
- 051.07× vs 0.92×sales per view when face, text and product all appear in the first second (1.03–1.10) versus only one (0.88–0.96)
Contents
Abstract
This working paper asks how brands and creators should test video openings on TikTok Shop, and which openings look worth testing first. Using our analysis of US TikTok Shop videos, we compare sales per view across hook types, hook sources and what is on screen in the first second. Price or deal openings sold at 1.5× the market average (90% range 1.37–1.58), while borrowed clips sold at 0.68× (0.60–0.76); filmed-for-this-video hooks, which make up 89.4% of watched-video sales, sat at the average. These are observational associations, not tested effects, so we separate them from a proposed one-variable-at-a-time test plan.
1. Introduction
The short answer to the decision most brands face: test one opening at a time. Change only the first seconds of the video, hold the product, offer, creator, script body and length fixed, and compare sales per view across the variants. In our analysis, price or deal and bold-claim openings are associated with higher sales per view than the market average, so they are reasonable candidates for a first test. This is a hypothesis for testing, not a finding that they will work for your product. This paper covers US TikTok Shop observations, not all UGC everywhere. Opening choices matter to brands and creators because the first seconds are the part of a video that is easiest to change and cheapest to retest. Prior work on short-video popularity finds that creator features matter most and that early popularity predicts later popularity [1] [2]. Work on advertising measurement also shows why returns are hard to read from observational data [3]. We therefore treat the hook patterns below as leads, and we separate what we measured from what we propose to test next.
2. Data
The window runs from 19 September to 18 October 2026. We tracked 51,843 videos across 29 categories. Our AI analyst watched and analysed 9,285 of them in depth; this is a count of videos, not of views. For each analysed video we recorded the type of hook, where the hook footage came from, and whether a face, on-screen text or the product appeared in the first second. We also recorded how many of those three elements appeared. Sales are the revenue attributed to each video in the window.
Daily rankings of top-selling TikTok Shop videos in the US were collected from several independent sources and merged into one record per video. Where sources overlap, their sales estimates are cross-checked against each other, and videos whose estimates disagree by more than half are flagged. An AI analyst watched each video and recorded its opening, format, angle, production style, use of AI, hook source, length, pacing, what appears in the first second and how it is presented (people on screen, voice-over, setting, UGC or studio feel), without seeing how the video sold. Sales per view is a video group’s revenue per view divided by the market’s, shrunk toward the average for small groups, with 90% ranges. This paper covers 2026-09-19 to 2026-10-18: 51,843 videos tracked, 9,285 of them watched and analysed.
3. Methods
Sales per view is a group of videos’ revenue per view divided by the market’s revenue per view, so 1 is the market average. Estimates for small groups are shrunk toward the average by empirical Bayes [4], which pulls thin groups toward 1 and makes them harder to over-read. We report 90% intervals computed on the log scale. Where an interval spans 1, the group is not clearly different from the market average. Share of sales is a group’s share of the revenue of the watched videos. Confidence labels from the evidence are quoted where they are lower than high. Hook type, hook source and the first-second elements were labelled by our AI analyst, so some labelling error is possible.
4. Results: which hook types sell per view
Price or deal openings had the highest sales per view, at 1.5× the market (range 1.37–1.58), across 492 videos and 5.6% of watched-video sales. Bold claims followed at 1.2× (1.19–1.29), with 1,361 videos and 17% of sales. Result-first openings were at 1.2× (1.07–1.31), based on 266 videos. The two largest groups by sales were close to average: relatable POV (1,558 videos, 18.5% of sales) at 0.98× (0.95–1.02) and problem call-outs (1,123 videos, 13.5%) at 0.98× (0.94–1.02). Going straight into the demo was at 0.92× (0.87–0.98), and story openers at 0.90× (0.81–1.00). Questions, unboxing reveals and social proof had ranges that include 1, so we do not read them as clearly different from average.
| Value | Videos (n) | Share of sales | Sales per view | 90% range |
|---|---|---|---|---|
| Price or deal | 492 | 5.6% | 1.47× | 1.37–1.57 |
| Bold claim | 1,361 | 17% | 1.24× | 1.19–1.29 |
| Result first | 266 | 3.7% | 1.19× | 1.07–1.31 |
| Other | 74 | 0.8% | 1.14× | 0.87–1.48 |
| Social proof | 212 | 2.6% | 1.10× | 1.00–1.22 |
| Question | 428 | 4.6% | 1.03× | 0.95–1.12 |
| Unboxing reveal | 287 | 2.9% | 1.01× | 0.92–1.12 |
| Relatable POV | 1,558 | 18.5% | 0.98× | 0.95–1.02 |
| Problem call-out | 1,123 | 13.5% | 0.98× | 0.94–1.02 |
| Straight into the demo | 661 | 6.5% | 0.92× | 0.87–0.98 |
Note. Sales per view is relative to the market (1.00 = average), shrunk toward the average for small groups (empirical Bayes); ranges are 90% intervals on the log scale.
5. Results: where the opening footage comes from
Hooks filmed for the video made up 89.4% of watched-video sales (6,534 videos) and sat at the market average, 1.00× (0.99–1.02). Product close-ups were also near average, at 1.01× (0.90–1.12). Borrowed clips (TV, film, news, viral) were the clearest weak spot, at 0.68× (0.60–0.76) across 144 videos. AI-generated clips (1.54×, 1.30–1.83) and meme or reaction clips (1.43×, 1.08–1.89) were higher but rest on 99 and 34 videos and 1.1% and 0.7% of sales. Text cards were at 1.23× (0.99–1.52) from 45 videos, and the range includes 1. The small non-filmed groups are leads for testing, not settled results.
6. Results: what is on screen in the first second
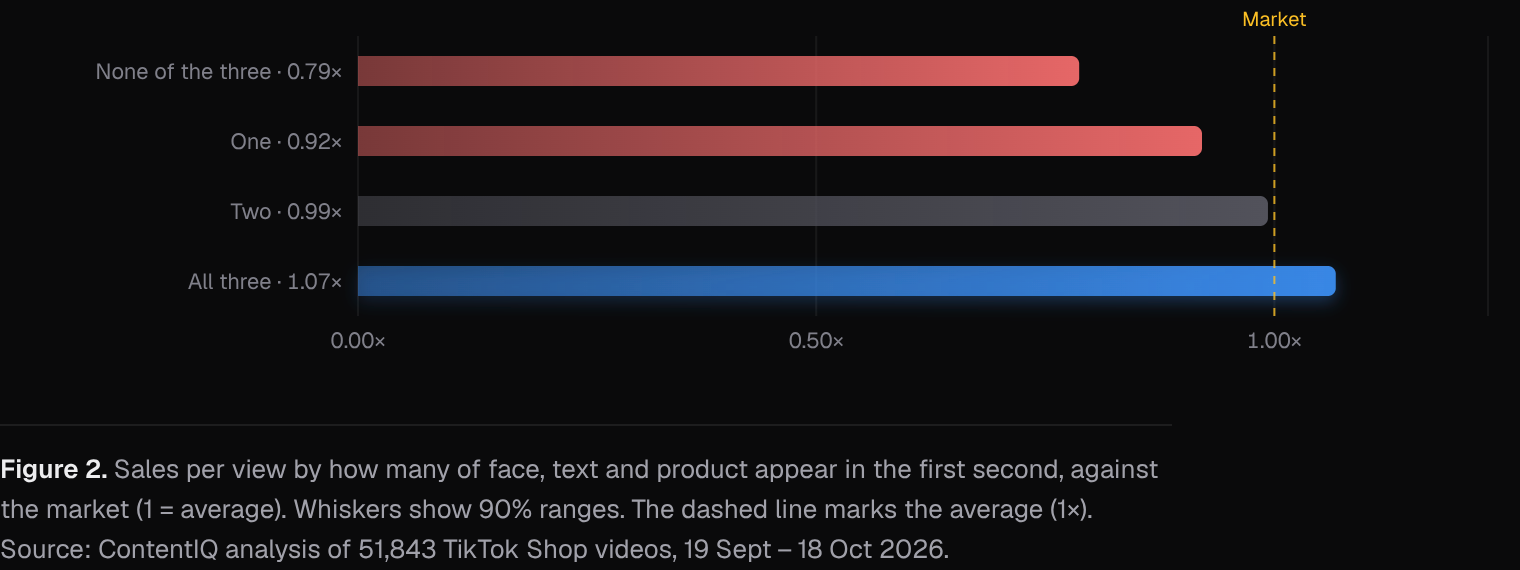
Videos with a face in the first second sold at 1.04× (1.02–1.07), against 0.93× (0.91–0.96) without. Product in the first second was at 1.03× (1.01–1.05) against 0.90× (0.86–0.94) without. For on-screen text the ranges overlap: 0.99× (0.97–1.01) with text and 1.03× (0.995–1.06) without. Counting the elements together, videos with all three were at 1.07× (1.03–1.10), covering 2,255 videos and 32% of sales. Two elements gave 0.99× (0.97–1.02), one gave 0.92× (0.88–0.96), and none gave 0.79× (0.63–0.98), but that last group has only 51 videos. The pattern is that fuller first seconds are associated with higher sales per view. It does not show that adding elements causes sales.
7. Discussion
For brands and creators, the evidence suggests a clear ordering of hypotheses. Offer-led and claim-led openings (price or deal, bold claim) sold above average, borrowed clips sold below it, and most other common openings sat near 1. Filmed footage is the default and sits at the average, so the question is what you say and show in it, not whether to film. Alternative explanations are strong. Price or deal openings may go with products that already have discounts or a strong offer, and creator size, paid promotion, product price and category mix could all drive sales per view independently of the opening. Face and product in the first second may also be markers of a more polished or established creator. The prior literature suggests creator features carry much of the signal [1] and that observational returns are hard to isolate [3]. Recommendation, not a finding: use the checklist below as a test plan. 1. Pick one product and one offer, and keep both fixed. 2. Write down the single variable you will change, such as hook type (price or deal, bold claim, relatable POV), hook source (filmed, text card) or first-second contents (face, text, product). 3. Keep creator, script after the opening, length, caption and posting time as similar as you can, or use the same creator for all variants. 4. Make each variant differ only in the first seconds. 5. Fix the minimum views you need before launch, and decide in advance how you will compare sales per view. 6. Run the variants in the same period, and treat the baseline as your relatable POV or current opening. 7. Record paid promotion on each variant, since it can change reach. 8. After the test, keep a variant only if it sells per view above your baseline in your own data, and then change the next single variable. Treat our market figures as starting hypotheses, not as predictions for your product.
8. What this means for brands and founders
- Test an offer-led opening first: price or deal openings sold at 1.5× the market average per view (range 1.37–1.58), so put them against your current opening as a hypothesis, not a promise.
- Test a bold claim as a second variant: these openings sold at 1.2× the market (1.19–1.29) and made up 17% of watched-video sales, so the pattern rests on 1,361 videos.
- Skip borrowed clips as a default opening: they sold at 0.68× the market average per view (0.60–0.76) across 144 videos, so use filmed footage as your baseline.
- Put face and product in the first frame when you can: videos with all three of face, text and product in the first second sold at 1.07× (1.03–1.10) against 0.92× (0.88–0.96) with only one, though this does not show cause.
- Treat AI-generated, meme and text-card hooks as small side tests: their sales per view (1.54×, 1.43×, 1.23×) rest on 99, 34 and 45 videos and 1.1%, 0.7% and 0.6% of sales.
9. Conclusion
In our analysis of US TikTok Shop videos, price or deal and bold-claim openings were associated with above-average sales per view, borrowed clips with below-average sales per view, and filmed hooks with the average. Fuller first seconds, with face, text and product together, were also associated with higher sales per view. These are correlations from one 30-day window, so they are not tests. The practical route is to test one opening at a time against your own baseline, record what you changed, and use these results to choose which opening to test first.
Methodology
Daily rankings of top-selling TikTok Shop videos in the US were collected from several independent sources and merged into one record per video. Where sources overlap, their sales estimates are cross-checked against each other, and videos whose estimates disagree by more than half are flagged. An AI analyst watched each video and recorded its opening, format, angle, production style, use of AI, hook source, length, pacing, what appears in the first second and how it is presented (people on screen, voice-over, setting, UGC or studio feel), without seeing how the video sold. Sales per view is a video group’s revenue per view divided by the market’s, shrunk toward the average for small groups, with 90% ranges. This paper covers 2026-09-19 to 2026-10-18: 51,843 videos tracked, 9,285 of them watched and analysed.
Limitations
Most videos in the sample are top-ranked, so findings mostly separate strong sellers from good ones rather than from all videos; typical and weak videos are being added. Results are associations, not causes. Paid promotion, creator audience size and product price are not fully controlled for. Revenue, views and sales are estimates, not figures reported by TikTok. These are observational US TikTok Shop data over a 30-day window (19 September–18 October 2026), so the associations are not causal and may not hold in other periods or markets. Hooks, sources and first-second elements were labelled by an AI analyst, so some labelling error is possible. Only 9,285 of 51,843 tracked videos were analysed in depth. Creator size, paid promotion, product price, discounts and category mix are not controlled for in the hook comparisons, and any of them could explain part of the differences. Several groups are small (AI-generated clips, meme or reaction clips, text cards, stitches or duets, and the none-of-three first-second group), and one, another creator’s clip, stitch or duet, has only medium confidence. Face, text and product were recorded as present or absent, so we do not know how prominently each appeared. The test plan is a recommendation and has not been run by us.
References
- [1]Ye, L., Zhang, Y., Wu, Y., et al. (2025). MVP: Winning solution to SMP Challenge 2025 video track. arXiv:2507.00950. arxiv.org/abs/2507.00950
- [2]Szabo, G., & Huberman, B. A. (2010). Predicting the popularity of online content. Communications of the ACM, 53(8), 80–88. cacm.acm.org/research/predicting-the-popularity-of-online-content
- [3]Lewis, R. A., & Rao, J. M. (2015). The unfavorable economics of measuring the returns to advertising. The Quarterly Journal of Economics, 130(4), 1941–1973.
- [4]Efron, B., & Morris, C. (1975). Data analysis using Stein’s estimator and its generalizations. Journal of the American Statistical Association, 70(350), 311–319.
Cite as
MediaLabs Research, in collaboration with Coherence Limited (2026). UGC hook testing: a framework for TikTok Shop. ContentIQ Working Paper CIQ-WP-2026-60, version 1. https://medialabs-co.com/research/ugc-hook-testing
Analysis and data: Coherence Research, Coherence ContentIQ. Published by MediaLabs in collaboration with Coherence Limited.
Version history
- Version 118 Oct 2026This version