ContentIQ working paperCIQ-WP-2026-59CreativeVersion 118 Oct 2026
UGC performance metrics: go beyond video views
51,843 videos tracked, 29 categories, 19 Sept–18 Oct 2026
MediaLabs Research · in collaboration with Coherence Limited
Key findings
- 0166.4%of top-video revenue came with paid promotion, on 16.1% of views (a lower bound)
- 02$17.06 vs $16.02revenue per 1,000 views, organic vs paid-led top-selling videos
- 03148.8 vs 37.3likes per 1,000 views, organic vs paid-led videos
- 042.37median return on ad spend of paid video snapshots (middle half 1.95 to 2.81)
- 0527.7%of paid video snapshots had a return on ad spend under 2
- 06$11.69 to $38.91range of organic revenue per 1,000 views across the categories we report
Contents
Abstract
Views, engagement and attributed sales answer different questions, and in US TikTok Shop data they diverge. Across top-selling videos, at least 66.4% of revenue came with paid promotion on 16.1% of views (lower bounds). Revenue per 1,000 views was similar across paid bands ($16.02 to $17.06), while likes per 1,000 views fell from 148.8 for organic videos to 37.3 for paid-led ones. Median return on ad spend for paid video snapshots was 2.37 (middle half 1.95 to 2.81), and 27.7% were under 2. We propose a measurement template and a test plan, clearly labelled as recommendations rather than findings.
1. Introduction
Short answer for the reader's decision: do not judge UGC on views alone. Treat views as a measure of reach, likes and shares as a measure of audience response, and revenue per 1,000 views, paid share and return on ad spend as the commercial measures. In our data these three sets of metrics do not move together, so a video that looks weak on one can look ordinary on another.
This matters because brands and creators choose what to brief, boost and repeat based on whichever number is easiest to see. Research on online content shows attention is long-tailed and that early popularity predicts later popularity [1], and short-video prediction work centres on popularity, with creator features mattering most [2]. Popularity, however, is not revenue. Separately, the returns to advertising are hard to measure from observational data [3], which is a warning for any paid-versus-organic comparison.
We ask: among top-selling US TikTok Shop videos, how do views, engagement and attributed revenue relate, how much revenue comes with paid promotion, and what does the observed distribution of revenue per view imply for a measurement template? These are US TikTok Shop observations, not a statement about all UGC everywhere.
2. Data
The window runs from 19 September to 18 October 2026. Our analysis tracked 51,843 videos across 29 categories. The paid-promotion and revenue figures rest on 33,825 top-selling videos and 110,867 video snapshots (one row per video and observation date). This paper does not use in-depth creative analysis, so it covers only the sales, views, engagement and paid-share fields, not creative content.
For each video snapshot we use weekly revenue, views, likes and shares, the share of revenue and views that came from paid promotion, estimated return on ad spend where there was paid spend, and video age. The category tables report 25 categories with sufficient figures.
Weekly figures for the top-selling TikTok Shop videos in the US were collected from commercial data providers: each video’s estimated revenue, views and engagement in each week it ranked, the share of its revenue and views that came from paid promotion (reported per video and top-coded at 80%), its estimated return on ad spend and its publish date. One row is one video on one observation date (a video snapshot). This paper covers 2026-09-19 to 2026-10-18: 51,843 videos tracked.
Daily seven-day video snapshots can overlap and repeat the same video. Counts are observations, not independent weeks. Aggregate shares and medians are snapshot-weighted; summed revenue is not unique sales over the publication window.
3. Methods
Paid share is reported per video and top-coded at 80%. Market and category shares weight videos by their revenue (or views), so they are lower bounds. Videos with under 10% of revenue paid are called organic, and we also report mixed (10 to 50%), mostly paid (50 to 80%) and paid-led (80% or more) bands. Return on ad spend (ROAS) is estimated revenue per dollar of ad spend, summarised by its median and middle half. The paid-versus-organic framing follows the observational-measurement caution in [3].
Video economics use the distribution of weekly revenue per video snapshot, revenue and engagement per 1,000 views (totals divided by total views), and category-level aggregates from weekly figures. Long-tailed attention motivates reporting medians and shares rather than means alone [1].
All comparisons are descriptive. We report no causal estimates, and the sample consists of top-selling videos, so it is selected on the outcome.
4. Results: paid promotion, engagement and revenue per view
Paid-led videos (80% or more paid) made up 56.8% of video snapshots and 65.9% of revenue. Organic videos made up 21% of video snapshots and 11.9% of revenue. Across the market, paid promotion accounted for at least 66.4% of top-video revenue but only 16.1% of views.
Revenue per 1,000 views barely differed by band: $17.06 for organic, $16.12 for mixed, $16.94 for mostly paid and $16.02 for paid-led. Engagement differed sharply. Likes per 1,000 views fell from 148.8 (organic) to 96.2, 43.8 and 37.3, and shares per 1,000 views from 16.5 to 11.3, 5.2 and 4.7.
Median weekly revenue rose with paid share, from $1,550 (organic) to $3,685 (paid-led). Median video age was 30 days for organic, 28 for mixed, 13 for mostly paid and 28 for paid-led videos. Because these are top-selling videos only, we cannot say whether engagement predicts sales more generally.
| Paid share of the video’s revenue | video snapshots (n) | Share of revenue | Revenue per 1,000 views | Median weekly revenue | Likes per 1,000 views | Median ROAS |
|---|---|---|---|---|---|---|
| Organic (under 10% paid) | 23,310 | 11.9% | $17.06 | $1.6K | 148.8 | — |
| Mixed (10–50% paid) | 6,933 | 5% | $16.12 | $2.5K | 96.2 | 2.34× |
| Mostly paid (50–80%) | 17,688 | 17.2% | $16.94 | $3.3K | 43.8 | 2.43× |
| Paid-led (80% or more) | 62,936 | 65.9% | $16.02 | $3.7K | 37.3 | 2.36× |
Note. A video snapshot is one video’s rolling seven-day metrics on an observation date. The paid share is reported per video and top-coded at 80%, so paid shares are lower bounds. ROAS is estimated revenue per dollar of ad spend.
5. Results: revenue per 1,000 views by category
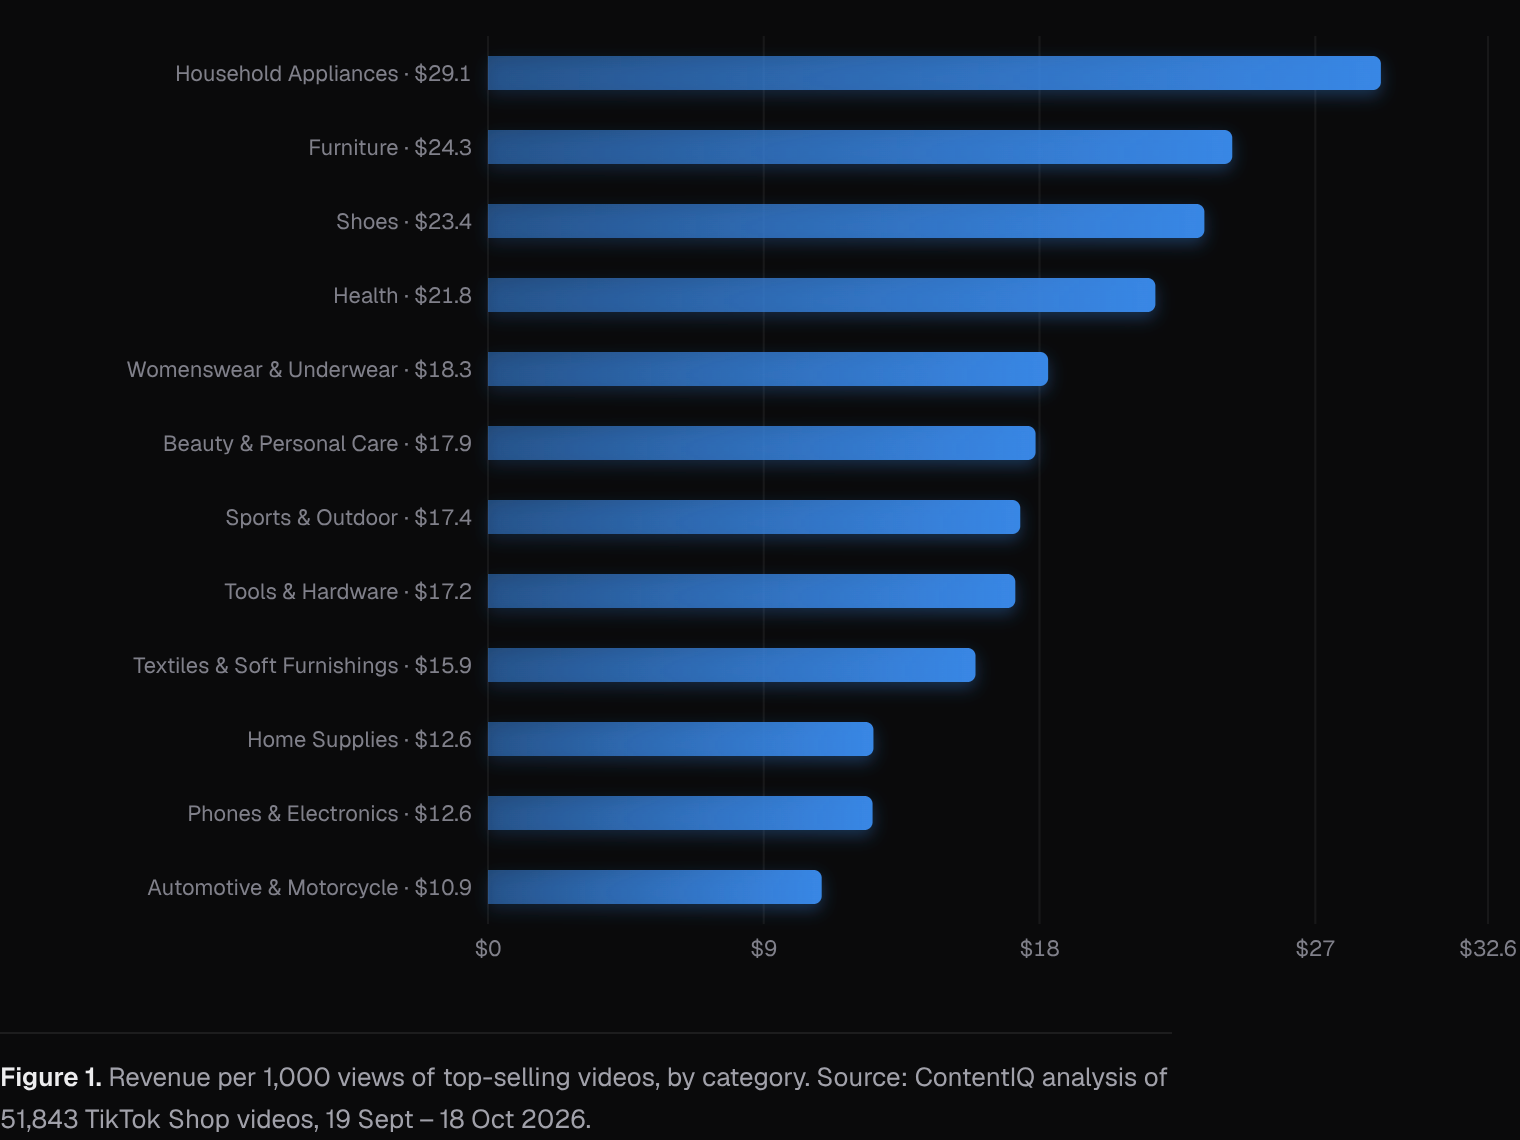
Revenue per 1,000 views varies much more across categories than across paid bands. For organic videos it ranged from $11.69 (Home Supplies) to $38.91 (Household Appliances). Furniture ($33.34), Shoes ($27.14) and Health ($26.50) were also high.
Organic and paid-led figures did not move in one direction. Household Appliances was $38.91 organic against $28.98 paid-led, and Phones & Electronics $18.89 against $11.82. Baby & Maternity went the other way, at $12.73 organic against $22.87 paid-led. Category weeks per category range from roughly 3,100 to 5,000, so single-category gaps may be noisy and we do not report ranges for them.
6. Results: return on ad spend by category
Across paid video snapshots the median estimated ROAS was 2.37, with a middle half of 1.95 to 2.81. In 27.7% of paid video snapshots it was under 2. Whether any given ROAS is profitable depends on margins we do not observe.
By category, Beauty & Personal Care had the highest median (2.91, middle half 2.39 to 3.28), followed by Womenswear & Underwear (2.86) and Menswear & Underwear (2.75). The lowest medians were Jewelry Accessories & Derivatives (1.94, middle half 1.60 to 2.32) and Baby & Maternity (1.96, middle half 1.66 to 2.29).
Paid revenue shares also differed: Household Appliances reached 72.4% of revenue paid, while Kids' Fashion was lowest at 51.6%. Kids' Fashion and Food & Beverages had the highest shares of organic video snapshots (31.6% and 30%). Paid shares are lower bounds throughout.
| Category | video snapshots (n) | Paid share of revenue | Paid share of views | Mostly organic video snapshots | Median ROAS (middle half) |
|---|---|---|---|---|---|
| Beauty & Personal Care | 4,839 | 70.4% | 15.1% | 10.7% | 2.91× (2.4–3.3) |
| Womenswear & Underwear | 3,103 | 67.3% | 15.5% | 14.1% | 2.86× (2.5–3.1) |
| Household Appliances | 3,279 | 72.4% | 21.3% | 11.2% | 2.53× (2.1–3.0) |
| Phones & Electronics | 4,881 | 64.4% | 16.6% | 18.4% | 2.65× (2.1–3.0) |
| Sports & Outdoor | 4,676 | 66.1% | 21.4% | 20.1% | 2.56× (2.1–3.0) |
| Health | 3,789 | 70.3% | 33.5% | 14.3% | 2.41× (2.1–2.9) |
| Shoes | 3,443 | 67.5% | 31.7% | 15.7% | 2.49× (2.2–2.8) |
| Furniture | 4,048 | 66.1% | 20.5% | 16.4% | 2.20× (1.9–2.6) |
| Home Supplies | 3,755 | 66.6% | 13.8% | 15% | 2.67× (2.3–3.0) |
| Tools & Hardware | 4,585 | 67.9% | 10.6% | 14.9% | 2.43× (2.0–2.8) |
| Textiles & Soft Furnishings | 3,407 | 68.7% | 9.3% | 11.6% | 2.63× (2.3–2.9) |
| Automotive & Motorcycle | 5,017 | 67.8% | 13.6% | 17.9% | 2.51× (2.1–2.9) |
| Menswear & Underwear | 3,353 | 61.9% | 13.2% | 20.6% | 2.75× (2.4–3.1) |
| Fashion Accessories | 4,594 | 58.8% | 17.3% | 26.9% | 2.24× (1.9–2.7) |
| Home Improvement | 4,846 | 67.1% | 14% | 17.5% | 2.30× (1.9–2.7) |
Note. Mostly organic: under 10% of the video’s revenue paid. Paid shares are top-coded at 80% per video, so they are lower bounds.
7. Discussion
The pattern suggests views, engagement and revenue answer different questions. Views describe reach. Likes and shares per 1,000 views were highest for organic videos but did not come with higher revenue per 1,000 views. Revenue per view was close to flat across paid bands, while median weekly revenue was higher where more was paid. One reading is that paid reach buys revenue volume at a similar revenue per view. Alternatives are that paid views reach broader, less engaged audiences (lowering engagement rates), that brands boost videos already selling, and that selection into the top-seller list hides weaker videos. We cannot separate these, and returns to advertising are hard to measure observationally [3].
Recommendation, not a finding: a measurement template and test plan. (1) Record for every video views, likes and shares per 1,000 views, attributed revenue, the paid share of revenue and views, ad spend and video age. (2) Report revenue per 1,000 views and ROAS beside views, and split organic from paid-led videos so the two are never averaged together. (3) Compare against your category's benchmark, not the market's, since organic revenue per 1,000 views ranged from $11.69 to $38.91 across categories. (4) Set a ROAS floor from your own margins before boosting. (5) For a test, brief comparable creative variants, boost some and hold others as organic for a fixed period, and pre-set the decision rule and the metric (revenue per 1,000 views or ROAS). Stagger timing or use matched products to limit confounding, and treat small differences as noise.
These observations are about US TikTok Shop top-selling videos and are not evidence of current platform rules or of results for all UGC.
8. What this means for brands and founders
- Judge UGC on revenue per 1,000 views, not views alone: for organic top-selling videos it ranged from $11.69 to $38.91 by category, so benchmark against your own category.
- Plan for paid reach: at least 66.4% of top-video revenue came with paid promotion, on 16.1% of views, so check how much of a video's sales were paid before copying it.
- Set a ROAS floor from your own margins before boosting: the median estimated ROAS was 2.37 (middle half 1.95 to 2.81) and 27.7% of paid video snapshots were under 2.
- Do not read low likes as low sales: paid-led videos had 37.3 likes per 1,000 views against 148.8 for organic, yet revenue per 1,000 views was $16.02 against $17.06.
9. Conclusion
In US TikTok Shop top-selling videos, paid promotion was associated with at least 66.4% of revenue on 16.1% of views, revenue per 1,000 views was similar across paid bands ($16.02 to $17.06), and engagement per 1,000 views was far higher on organic videos. Median ROAS was 2.37, with more than a quarter of paid video snapshots under 2.
Brands and creators should therefore report views, engagement, revenue per view and ROAS together, split by paid share, and benchmark by category. The findings are descriptive, based on top sellers only, and with paid shares as lower bounds; the proposed template and test plan still need to be run and evaluated.
Methodology
Weekly figures for the top-selling TikTok Shop videos in the US were collected from commercial data providers: each video’s estimated revenue, views and engagement in each week it ranked, the share of its revenue and views that came from paid promotion (reported per video and top-coded at 80%), its estimated return on ad spend and its publish date. One row is one video on one observation date (a video snapshot). This paper covers 2026-09-19 to 2026-10-18: 51,843 videos tracked.
Daily seven-day video snapshots can overlap and repeat the same video. Counts are observations, not independent weeks. Aggregate shares and medians are snapshot-weighted; summed revenue is not unique sales over the publication window.
Limitations
Video figures cover top-selling videos only. Paid shares are reported per video and top-coded at 80%, so they are lower bounds; ad spend and margins are not observed, so a reported return on ad spend says nothing about profit. Results are associations, not causes. Paid promotion, creator audience size and product price are not fully controlled for. Revenue, views and sales are estimates, not figures reported by TikTok. The sample consists of top-selling videos, so findings are conditional on success and say nothing about videos that did not sell. Paid shares are top-coded at 80% and are lower bounds. ROAS is an estimate, and profitability depends on margins we do not observe. The window is a single 30-day period, no videos were analysed in depth for this paper, and results are US TikTok Shop observations that do not generalise to all UGC. All associations are observational; paid and organic videos differ in age, audience and selection, and we do not estimate causal effects. Daily seven-day video snapshots can overlap and repeat the same video. Counts are observations, not independent weeks. Aggregate shares and medians are snapshot-weighted; summed revenue is not unique sales over the publication window.
References
- [1]Szabo, G., & Huberman, B. A. (2010). Predicting the popularity of online content. Communications of the ACM, 53(8), 80–88. cacm.acm.org/research/predicting-the-popularity-of-online-content
- [2]Ye, L., Zhang, Y., Wu, Y., et al. (2025). MVP: Winning solution to SMP Challenge 2025 video track. arXiv:2507.00950. arxiv.org/abs/2507.00950
- [3]Lewis, R. A., & Rao, J. M. (2015). The unfavorable economics of measuring the returns to advertising. The Quarterly Journal of Economics, 130(4), 1941–1973.
Cite as
MediaLabs Research, in collaboration with Coherence Limited (2026). UGC performance metrics: go beyond video views. ContentIQ Working Paper CIQ-WP-2026-59, version 1. https://medialabs-co.com/research/ugc-performance-metrics
Analysis and data: Coherence Research, Coherence ContentIQ. Published by MediaLabs in collaboration with Coherence Limited.
Version history
- Version 118 Oct 2026This version