ContentIQ working paperCIQ-WP-2026-62CreativeVersion 118 Oct 2026
UGC product demonstrations: what to test on TikTok Shop
51,843 videos tracked, 9,285 analysed in depth, 29 categories, 19 Sept–18 Oct 2026
MediaLabs Research · in collaboration with Coherence Limited
Key findings
- 0136%of watched-video sales came from demo or tutorial videos (3,163 videos), at 0.96× market sales per view (0.94–0.99)
- 021.24×sales per view for voice-over B-roll (1.16–1.33, 561 videos), the highest of the formats with high confidence
- 031.03× vs 0.90×sales per view with the product on screen in the first second (1.01–1.05) versus without (0.86–0.94)
- 041.07× vs 0.92×sales per view when face, text and product all appear in the first second (1.03–1.10) versus only one (0.88–0.96)
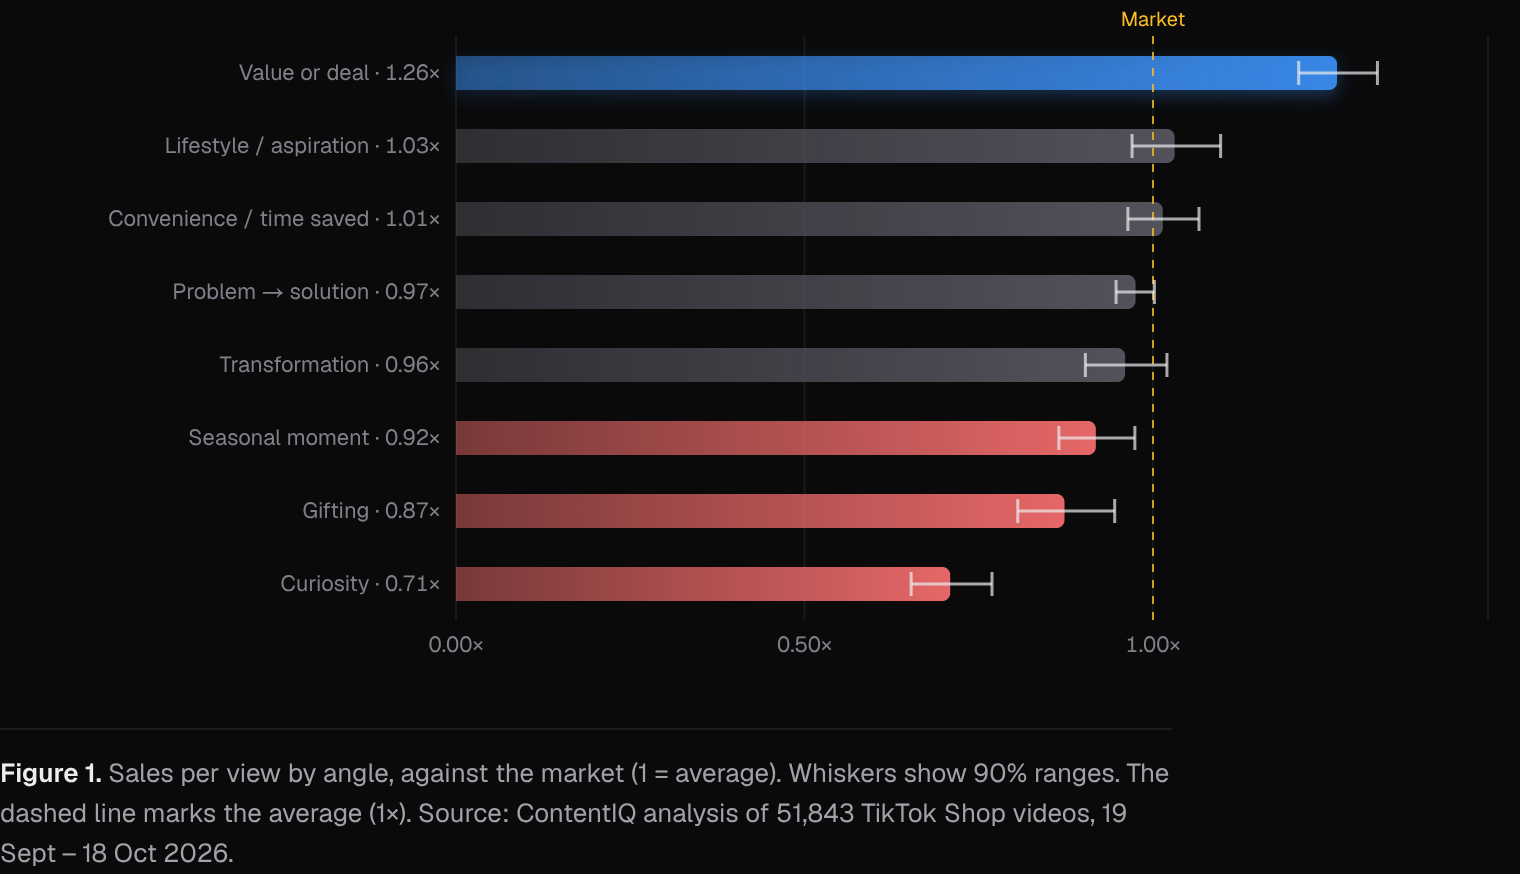
- 051.35×sales per view for urgency or scarcity angles (1.22–1.49, 235 videos); curiosity angles sold at 0.71× (0.65–0.77)
Contents
Abstract
Videos tagged as a demo or tutorial carried 36% of watched-video sales on US TikTok Shop but sold at 0.96× the market's sales per view (90% range 0.94–0.99), so demos are common rather than outstanding. Voice-over B-roll (1.24×), unboxing (1.20×) and review or testimonial formats (1.17×) sold above average. Videos that showed the product in the first second sold at 1.03× against 0.90× for those that did not. These are associations from observational data, not conversion effects, and the checklist and test plan in the Discussion are recommendations, not findings.
1. Introduction
Short answer: treat a product demonstration as a shot to build into your videos, not as a format that sells better by default, and test it against other formats before committing budget. In our analysis of US TikTok Shop, videos tagged demo or tutorial accounted for 36% of watched-video sales but sold at 0.96× the market's sales per view (90% range 0.94–0.99). Several other formats sold above average.
This matters to brands and the creators they brief because a demo is the default answer to 'what should the video show?'. Prior work on short-video performance has mostly studied popularity rather than sales. It suggests that attention is long-tailed and that early popularity predicts later popularity [1], and that creator features matter most in state-of-the-art popularity prediction [2]. Both point to large differences between videos that a format label alone will not explain. Measuring the returns to advertising from observational data is also known to be hard [3], so we report associations only.
This paper asks which video formats and opening shots are associated with higher sales per view, and proposes a shot checklist that makes the product benefit observable. The checklist is our recommendation and was not tested in this data. The findings describe US TikTok Shop, not all user-generated content everywhere.
2. Data
The window runs from 19 September to 18 October 2026. We tracked 51,843 videos across 29 categories, and our AI analyst watched and analysed 9,285 of them in depth. 'Watched' counts videos analysed, not views.
For each analysed video we recorded its format (for example demo or tutorial, voice-over B-roll, unboxing, review or testimonial), its angle (for example value or deal, problem → solution, curiosity), and whether a face, on-screen text and the product appeared in the first second. We also counted how many of those three first-second elements were present.
The data does not separate creator-made content from brand-made content, so 'UGC' here is a loose description of the style of video, not a measured category. Shares of sales are shares of the sales of watched videos.
Daily rankings of top-selling TikTok Shop videos in the US were collected from several independent sources and merged into one record per video. Where sources overlap, their sales estimates are cross-checked against each other, and videos whose estimates disagree by more than half are flagged. An AI analyst watched each video and recorded its opening, format, angle, production style, use of AI, hook source, length, pacing, what appears in the first second and how it is presented (people on screen, voice-over, setting, UGC or studio feel), without seeing how the video sold. Sales per view is a video group’s revenue per view divided by the market’s, shrunk toward the average for small groups, with 90% ranges. This paper covers 2026-09-19 to 2026-10-18: 51,843 videos tracked, 9,285 of them watched and analysed.
3. Methods
The main statistic is sales per view. For a group of videos, such as one format, we divide the group's revenue per view by the market's revenue per view, so 1 equals the market average and 1.24 means 24% more revenue per view than average.
Small groups are shrunk toward the average using empirical Bayes [4], which stops a handful of videos from producing extreme values. We give 90% intervals, computed on the log scale. Where an interval spans 1, the group cannot be told apart from average. Groups with few videos are flagged as medium confidence.
Share of sales is a group's revenue as a share of the revenue of watched videos. A format can have a large share because it is common, a high sales-per-view index because observed revenue relative to views is high, or both. We treat these as different questions.
4. Results: format
Demo or tutorial was the most common high-revenue format, with 3,163 videos and 36% of watched-video sales. Its sales per view was 0.96× the market (0.94–0.99), slightly below average. Review or testimonial was next at 14.1% of sales with 1.17× (1.12–1.22), and talking head had 12.1% with 1.10× (1.05–1.16).
The highest sales per view among formats with high confidence were voice-over B-roll at 1.24× (1.16–1.33, 561 videos, 5.8% of sales) and unboxing at 1.20× (1.10–1.32, 309 videos, 3.2%). Skit sold below average at 0.89× (0.82–0.96, 441 videos).
Some formats are thin. Day in the life shows 1.38× but rests on 16 videos with a range of 0.86–2.21, and live clip shows 1.19× on 35 videos with a range of 0.82–1.73. Both are medium confidence and cannot be separated from average.
| Value | Videos (n) | Share of sales | Sales per view | 90% range |
|---|---|---|---|---|
| Day in the life | 16 | 0.1% | 1.38× | 0.86–2.21 |
| Voice-over B-roll | 561 | 5.8% | 1.24× | 1.16–1.32 |
| Unboxing | 309 | 3.2% | 1.20× | 1.10–1.32 |
| Live clip | 35 | 0.4% | 1.19× | 0.82–1.73 |
| Review or testimonial | 1,071 | 14.1% | 1.17× | 1.12–1.22 |
| Talking head | 987 | 12.1% | 1.10× | 1.05–1.16 |
| Comparison | 260 | 4% | 1.09× | 0.99–1.19 |
| Green screen | 65 | 0.8% | 1.05× | 0.83–1.33 |
| Routine / GRWM | 314 | 3.7% | 1.00× | 0.92–1.09 |
| Demo or tutorial | 3,163 | 36% | 0.96× | 0.94–0.99 |
Note. Sales per view is relative to the market (1.00 = average), shrunk toward the average for small groups (empirical Bayes); ranges are 90% intervals on the log scale.
5. Results: the first second
Videos that showed the product in the first second made up 81.6% of watched-video sales (6,358 videos) and sold at 1.03× (1.01–1.05). Those that did not sold at 0.90× (0.86–0.94, 1,220 videos). A face in the first second gave 1.04× (1.02–1.07) against 0.93× without (0.91–0.96).
On-screen text did not show the same pattern. With text the figure was 0.99× (0.97–1.01), without it 1.03× (0.995–1.06), and the ranges overlap.
Combining the elements, videos with all three in the first second sold at 1.07× (1.03–1.10, 2,255 videos, 32% of sales). Two elements gave 0.99× (0.97–1.02), one gave 0.92× (0.88–0.96), and none gave 0.79× (0.63–0.98) on only 51 videos. Because text alone is not associated with higher sales per view, we cannot say which element drives the combined result.
| In the first second | Videos (n) | Share of sales | Sales per view | 90% range |
|---|---|---|---|---|
| Face in the first second: yes | 4,456 | 63.5% | 1.04× | 1.02–1.07 |
| Face in the first second: no | 3,122 | 36.5% | 0.93× | 0.91–0.96 |
| Text on screen in the first second: yes | 5,144 | 69.1% | 0.99× | 0.97–1.01 |
| Text on screen in the first second: no | 2,434 | 30.9% | 1.03× | 0.99–1.06 |
| Product in the first second: yes | 6,358 | 81.6% | 1.03× | 1.01–1.05 |
| Product in the first second: no | 1,220 | 18.4% | 0.90× | 0.86–0.94 |
Note. Each pair splits the same videos; sales per view is relative to the market (1.00 = average), shrunk toward the average for small groups; ranges are 90% intervals.
6. Results: angle
Sales-per-view indices also varied across offer angles; this is not a formal comparison of the importance of angle versus format. Urgency or scarcity sold at 1.35× (1.22–1.49, 235 videos, 3% of sales) and value or deal at 1.26× (1.21–1.32, 1,325 videos, 15.8%). Social proof (1.21×, 1.10–1.33) and education (1.18×, 1.06–1.32) were also above average.
Problem → solution accounted for 33.4% of sales across 2,581 videos and sold at 0.98× (0.95–1.00). Transformation sold at 0.96× (0.90–1.02). Curiosity was the weakest angle at 0.71× (0.65–0.77, 460 videos).
Angles and formats were tagged separately and we have not cross-tabulated them, so we cannot say whether a demo with a deal angle behaves differently from a demo without one.
7. Discussion
What the data shows: demos are the most used way to sell on US TikTok Shop and sell at about the market average per view, while voice-over B-roll, unboxing and review formats sell somewhat above it, and showing the product at once is associated with higher sales per view. What it cannot show: whether a demo made the benefit visible, whether format caused any difference, or what any change would do to conversion. Likely alternative explanations are creator quality, which dominates popularity prediction in prior work [2], category and price mix, paid promotion, and deal-led offers. Observational returns to advertising are notoriously hard to measure [3].
Recommendation, not a finding. Shot checklist for a demo: (1) the product is in frame in the first second; (2) a hand or face is on screen with it; (3) the claimed benefit is shown happening in one uninterrupted shot rather than described; (4) a close-up of the detail that delivers the benefit; (5) a visible before and after state or a measurable result, where honest; (6) the claim is stated in voice or text at the same moment it is shown; (7) a clear call to the offer you actually have.
Recommendation, not a finding. Test plan: for one product, brief three versions with the same offer, similar length and, where possible, the same creator: a demo built to the checklist, a voice-over B-roll version, and a review or unboxing version. Decide the comparison in advance (sales per view over the same days), set a minimum number of views before reading results, and repeat on a second product before generalising. Treat results as evidence for your product, not proof of causation.
8. What this means for brands and founders
- Test the demo against other formats: demo or tutorial videos were 36% of watched-video sales but sold at 0.96× market sales per view (0.94–0.99), while voice-over B-roll sold at 1.24× (1.16–1.33).
- Put the product in the first second: videos that did sold at 1.03× market sales per view, against 0.90× for those that did not (0.86–0.94), though this is an association, not a guaranteed uplift.
- Check your offer angle before the shot list: value or deal angles sold at 1.26× (1.21–1.32) and curiosity angles at 0.71× (0.65–0.77), so test a real offer alongside the demo.
- Be cautious with thin formats: day in the life showed 1.38× on only 16 videos, with a range of 0.86–2.21, which is too wide to plan around.
9. Conclusion
In this US TikTok Shop sample, demo or tutorial is the largest format by sales (36%) but sits slightly below the market on sales per view (0.96×, 0.94–0.99). Voice-over B-roll, unboxing and review formats, and openings that show the product, a face and text together, are associated with higher sales per view.
These are associations over one 30-day window and cannot be read as conversion uplifts. A demo built around an observable benefit is a reasonable hypothesis, and the checklist and test plan above are a way to test it on your own products.
Methodology
Daily rankings of top-selling TikTok Shop videos in the US were collected from several independent sources and merged into one record per video. Where sources overlap, their sales estimates are cross-checked against each other, and videos whose estimates disagree by more than half are flagged. An AI analyst watched each video and recorded its opening, format, angle, production style, use of AI, hook source, length, pacing, what appears in the first second and how it is presented (people on screen, voice-over, setting, UGC or studio feel), without seeing how the video sold. Sales per view is a video group’s revenue per view divided by the market’s, shrunk toward the average for small groups, with 90% ranges. This paper covers 2026-09-19 to 2026-10-18: 51,843 videos tracked, 9,285 of them watched and analysed.
Limitations
Most videos in the sample are top-ranked, so findings mostly separate strong sellers from good ones rather than from all videos; typical and weak videos are being added. Results are associations, not causes. Paid promotion, creator audience size and product price are not fully controlled for. Revenue, views and sales are estimates, not figures reported by TikTok. Observations cover US TikTok Shop over a single 30-day window, and only the 9,285 videos analysed in depth, tagged by an AI analyst whose labels may contain errors. The data does not separate creator-made from brand-made content, or paid from organic reach, and we did not control for creator, category, price or offer. Format and angle were not cross-tabulated, and the format tag does not record whether the benefit was visibly demonstrated. Sales per view is not a conversion rate. Several formats (day in the life, live clip, green screen) have few videos and wide ranges. The checklist and test plan are recommendations and were not measured.
References
- [1]Szabo, G., & Huberman, B. A. (2010). Predicting the popularity of online content. Communications of the ACM, 53(8), 80–88. cacm.acm.org/research/predicting-the-popularity-of-online-content
- [2]Ye, L., Zhang, Y., Wu, Y., et al. (2025). MVP: Winning solution to SMP Challenge 2025 video track. arXiv:2507.00950. arxiv.org/abs/2507.00950
- [3]Lewis, R. A., & Rao, J. M. (2015). The unfavorable economics of measuring the returns to advertising. The Quarterly Journal of Economics, 130(4), 1941–1973.
- [4]Efron, B., & Morris, C. (1975). Data analysis using Stein’s estimator and its generalizations. Journal of the American Statistical Association, 70(350), 311–319.
Cite as
MediaLabs Research, in collaboration with Coherence Limited (2026). UGC product demonstrations: what to test on TikTok Shop. ContentIQ Working Paper CIQ-WP-2026-62, version 1. https://medialabs-co.com/research/ugc-product-demonstrations
Analysis and data: Coherence Research, Coherence ContentIQ. Published by MediaLabs in collaboration with Coherence Limited.
Version history
- Version 118 Oct 2026This version