ContentIQ working paperCIQ-WP-2026-63CreativeVersion 118 Oct 2026
UGC testimonial videos: evidence and testing ideas
51,843 videos tracked, 9,285 analysed in depth, 29 categories, 19 Sept–18 Oct 2026
MediaLabs Research · in collaboration with Coherence Limited
Key findings
- 011.17×sales per view for review or testimonial videos (90% range 1.12–1.22), from 1,071 videos
- 0214.1%share of watched-video sales carried by review or testimonial videos
- 030.96×sales per view for demo or tutorial videos (0.94–0.99), which carry 36% of sales
- 041.34×sales per view for a sceptic-convinced tone (1.18–1.53), from only 97 videos
- 050.62×sales per view for an emotional tone (0.56–0.68), the lowest tone
Contents
Abstract
We compared review and testimonial videos with other formats on US TikTok Shop, using sales per view (1 = the market average). Review or testimonial videos sold at 1.17× the market (90% range 1.12–1.22) and accounted for 14.1% of watched-video sales. Several other formats sold at similar or higher rates, so the evidence does not show testimonials to be the single best format. Demo or tutorial videos carried 36% of sales at 0.96×. These are observational associations, and a testimonial-style video says nothing about independent customer satisfaction.
1. Introduction
Short answer: testimonial-style videos are worth testing, but our evidence does not show they are the best format. On US TikTok Shop, review or testimonial videos sold at 1.17× the market's sales per view, above average with a narrow range. Voice-over B-roll and unboxing sold at similar or higher rates, and their ranges overlap with the testimonial range. The decision is therefore whether to add a testimonial format to a mix, not to replace everything with it.
This matters to brands and the creators they work with because testimonial content is a familiar briefing option, yet credibility is easy to assume and hard to measure. A person speaking to camera about a product is a format. It is not evidence of independent customer satisfaction, and we do not treat creator performance as a measure of it.
Prior work on short-video popularity finds that attention is long-tailed and that creator features matter most [1] [2]. Prior work also warns that the returns to advertising are hard to measure from observational data [3]. We therefore describe patterns and keep claims to association. This paper covers US TikTok Shop observations only, not all user-generated content everywhere.
2. Data
We tracked 51,843 videos on TikTok Shop between 19 September and 18 October 2026, across 29 categories. Our AI analyst watched and analysed 9,285 of them in depth. That figure counts videos analysed, not views.
For each analysed video we recorded the format (for example review or testimonial, demo or tutorial, unboxing, talking head) and the tone (for example enthusiastic, calm, emotional), alongside the video's views and revenue. Format and tone labels are assigned by our AI analyst from the video content, so they are a judgement and not a platform field.
The window is 30 days and covers one period only. We have no earlier version to compare against.
Daily rankings of top-selling TikTok Shop videos in the US were collected from several independent sources and merged into one record per video. Where sources overlap, their sales estimates are cross-checked against each other, and videos whose estimates disagree by more than half are flagged. An AI analyst watched each video and recorded its opening, format, angle, production style, use of AI, hook source, length, pacing, what appears in the first second and how it is presented (people on screen, voice-over, setting, UGC or studio feel), without seeing how the video sold. Sales per view is a video group’s revenue per view divided by the market’s, shrunk toward the average for small groups, with 90% ranges. This paper covers 2026-09-19 to 2026-10-18: 51,843 videos tracked, 9,285 of them watched and analysed.
3. Methods
The statistic throughout is sales per view. For a group of videos, we divide the group's revenue per view by the market's revenue per view, so 1 means the market average and 1.17 means 17% more revenue per view than average.
Small groups give noisy estimates, so each group's value is shrunk toward the average by empirical Bayes [4]. Intervals are 90% ranges computed on the log scale. Where two ranges overlap we do not treat the groups as different. Share of sales is each group's share of watched-video sales.
The design is observational. We do not adjust for category, price, creator size, paid promotion or product, so the results describe what sells at what rate, not what a format causes.
4. Results: review and testimonial against other formats
Review or testimonial was the second most common format in our table, with 1,071 videos, and carried 14.1% of watched-video sales. Its sales per view was 1.17× the market (90% range 1.12–1.22), with high confidence. Talking head sold at 1.10× (1.05–1.16) and carried 12.1% of sales.
It did not stand alone. Voice-over B-roll sold at 1.24× (1.16–1.33, 561 videos) and unboxing at 1.20× (1.10–1.32, 309 videos), and both ranges overlap the testimonial range. Day in the life (1.38×) and live clip (1.19×) had wide ranges that include 1 (0.86–2.21 and 0.82–1.73), on only 16 and 35 videos, so we draw no conclusion from them.
The largest format was demo or tutorial, with 3,163 videos and 36% of sales, but it sold at 0.96× (0.94–0.99), slightly below average per view. Skits were lower at 0.89× (0.82–0.96). High share of sales with average yield suggests volume, not efficiency, drives that share.
| Value | Videos (n) | Share of sales | Sales per view | 90% range |
|---|---|---|---|---|
| Day in the life | 16 | 0.1% | 1.38× | 0.86–2.21 |
| Voice-over B-roll | 561 | 5.8% | 1.24× | 1.16–1.32 |
| Unboxing | 309 | 3.2% | 1.20× | 1.10–1.32 |
| Live clip | 35 | 0.4% | 1.19× | 0.82–1.73 |
| Review or testimonial | 1,071 | 14.1% | 1.17× | 1.12–1.22 |
| Talking head | 987 | 12.1% | 1.10× | 1.05–1.16 |
| Comparison | 260 | 4% | 1.09× | 0.99–1.19 |
| Green screen | 65 | 0.8% | 1.05× | 0.83–1.33 |
| Routine / GRWM | 314 | 3.7% | 1.00× | 0.92–1.09 |
| Demo or tutorial | 3,163 | 36% | 0.96× | 0.94–0.99 |
Note. Sales per view is relative to the market (1.00 = average), shrunk toward the average for small groups (empirical Bayes); ranges are 90% intervals on the log scale.
5. Results: tone and the sceptic-convinced pattern
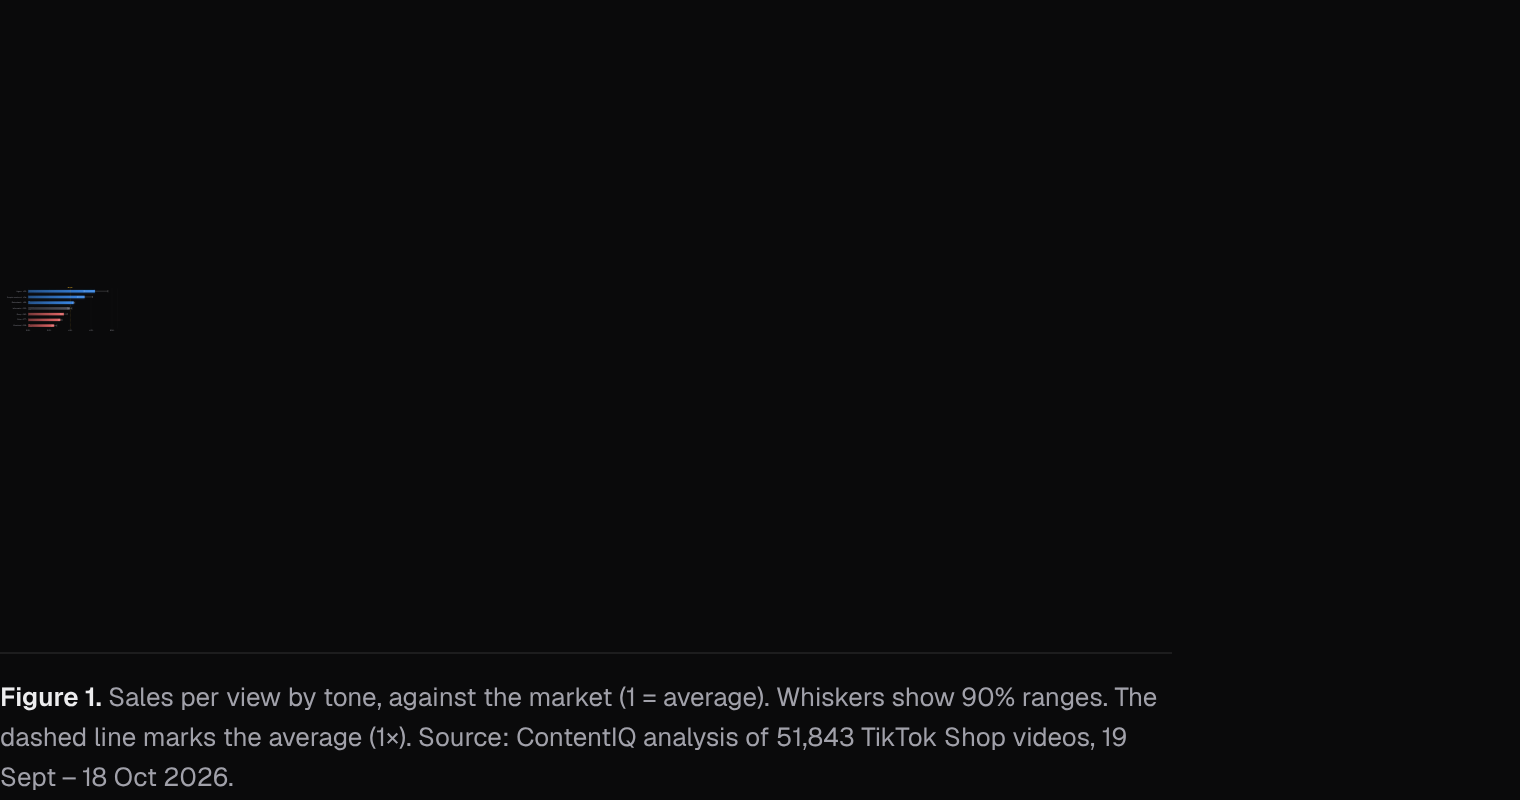
Tone separated videos more than format did. An emotional tone sold at 0.62× (0.56–0.68, 241 videos) and a calm tone at 0.77× (0.73–0.81, 1,108 videos), both well below average. Enthusiastic videos, 67.5% of sales, sold at 1.08× (1.06–1.11).
The highest tones were urgent (1.59×, range 1.33–1.90, 79 videos) and sceptic convinced (1.34×, range 1.18–1.53, 97 videos). These are small groups holding 0.9% and 1.5% of sales, so they are strong signals about a niche, not a market-wide pattern.
Sceptic convinced is a narrative that resembles a testimonial, but we did not cross-tabulate tone with format, so we cannot say how much of the effect sits inside review or testimonial videos.
6. Discussion
For brands, the evidence supports treating testimonial-style video as one format with an above-average observed index among several, not as a guaranteed winner. Its range sits above 1 and does not overlap the demo or tutorial range, but it overlaps B-roll and unboxing. Alternative explanations are plausible: testimonial videos may be made for products that already sell, may attract paid promotion, or may be made by creators with large audiences, and we did not control for any of these [2] [3].
Credibility needs care. A testimonial format records how a video is presented. It does not show that the speaker is an independent customer or that buyers were satisfied, and our data cannot separate genuine experience from performance. We therefore make no claim about authenticity.
Recommendation, not a finding: a simple test plan. (1) Pick one product and keep price, offer and landing page fixed. (2) Brief three to four formats from the table, such as testimonial, voice-over B-roll, unboxing and demo, with the same key claim. (3) Test tone within the same product and format; the pooled tone figures do not justify ruling out calm or emotional delivery. (4) Use similar creator sizes and the same promotion level across variants. (5) Compare revenue per view after a pre-agreed number of views. (6) Treat results as one test and repeat before changing the mix. If you use real customer experience, take it from actual customers with their permission and do not script claims you cannot support.
7. What this means for brands and founders
- Add a testimonial format to your test mix: review or testimonial videos sold at 1.17× the market per view (90% range 1.12–1.22), above average but not clearly above voice-over B-roll (1.24×) or unboxing (1.20×).
- Do not rely on demo or tutorial alone: it carried 36% of sales but sold at 0.96× per view (0.94–0.99), so test it against other formats.
- Test tone within your product rather than ruling out a style from pooled averages: enthusiastic videos sold at 1.08×, calm at 0.77× and emotional at 0.62×.
- Treat the sceptic-convinced angle as a small test: it sold at 1.34× (1.18–1.53) but from only 97 videos and 1.5% of sales.
- Judge any testimonial on revenue per view in a controlled test, not on how credible it looks: our data shows what sells at what rate, not customer satisfaction.
8. Conclusion
On US TikTok Shop in this 30-day window, review or testimonial videos sold at 1.17× the market per view (1.12–1.22) and carried 14.1% of watched-video sales. That is a solid, above-average result, but similar to voice-over B-roll and unboxing, and it is associated, not caused.
The tone results add a caution: emotional and calm videos sold well below average, while a few small groups sold well above it. Brands should test formats on one product with controlled conditions, as outlined above, before committing budget.
Methodology
Daily rankings of top-selling TikTok Shop videos in the US were collected from several independent sources and merged into one record per video. Where sources overlap, their sales estimates are cross-checked against each other, and videos whose estimates disagree by more than half are flagged. An AI analyst watched each video and recorded its opening, format, angle, production style, use of AI, hook source, length, pacing, what appears in the first second and how it is presented (people on screen, voice-over, setting, UGC or studio feel), without seeing how the video sold. Sales per view is a video group’s revenue per view divided by the market’s, shrunk toward the average for small groups, with 90% ranges. This paper covers 2026-09-19 to 2026-10-18: 51,843 videos tracked, 9,285 of them watched and analysed.
Limitations
Most videos in the sample are top-ranked, so findings mostly separate strong sellers from good ones rather than from all videos; typical and weak videos are being added. Results are associations, not causes. Paid promotion, creator audience size and product price are not fully controlled for. Revenue, views and sales are estimates, not figures reported by TikTok. Format and tone labels come from our AI analyst and may contain errors. We did not adjust for category, product, price, creator size or paid promotion, and we did not cross-tabulate tone with format. Day in the life (16 videos) and live clip (35 videos) are thin, and sceptic convinced and urgent are small groups. The window is 30 days, covers US TikTok Shop only, and cannot show causation or independent customer satisfaction.
References
- [1]Szabo, G., & Huberman, B. A. (2010). Predicting the popularity of online content. Communications of the ACM, 53(8), 80–88. cacm.acm.org/research/predicting-the-popularity-of-online-content
- [2]Ye, L., Zhang, Y., Wu, Y., et al. (2025). MVP: Winning solution to SMP Challenge 2025 video track. arXiv:2507.00950. arxiv.org/abs/2507.00950
- [3]Lewis, R. A., & Rao, J. M. (2015). The unfavorable economics of measuring the returns to advertising. The Quarterly Journal of Economics, 130(4), 1941–1973.
- [4]Efron, B., & Morris, C. (1975). Data analysis using Stein’s estimator and its generalizations. Journal of the American Statistical Association, 70(350), 311–319.
Cite as
MediaLabs Research, in collaboration with Coherence Limited (2026). UGC testimonial videos: evidence and testing ideas. ContentIQ Working Paper CIQ-WP-2026-63, version 1. https://medialabs-co.com/research/ugc-testimonial-videos
Analysis and data: Coherence Research, Coherence ContentIQ. Published by MediaLabs in collaboration with Coherence Limited.
Version history
- Version 118 Oct 2026This version