ContentIQ working paperCIQ-WP-2026-74TikTok ShopVersion 219 Oct 2026
TikTok Shop affiliate commission: setting a test budget
2,900 top-selling products tracked across 29 categories, 20 Sept–19 Oct 2026 (US)
MediaLabs Research · in collaboration with Coherence Limited
Version 2 · updated 19 Oct 2026
Key findings
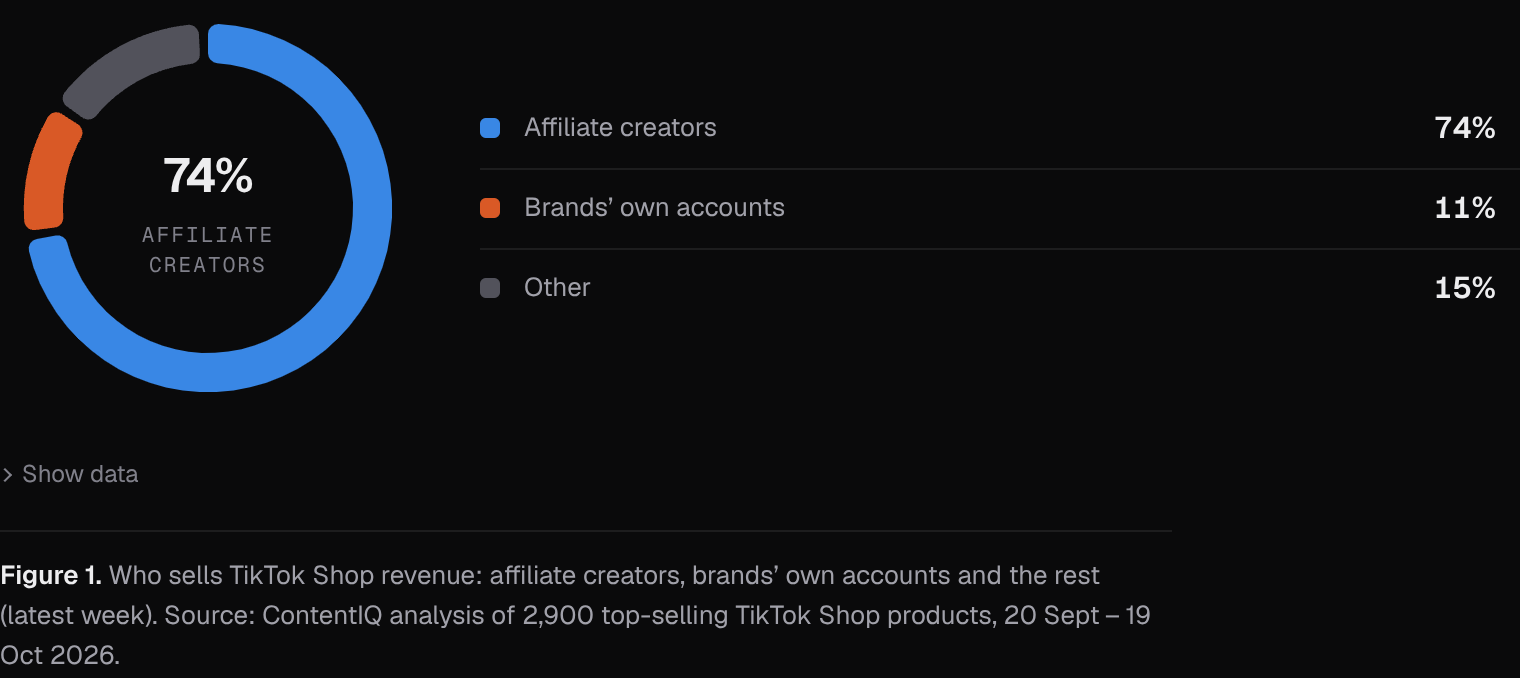
- 0174%of latest-week revenue across categories with reported channel data was credited to affiliate creators (brands' own accounts 11.4%, other 14.6%)
- 0210% vs 9%revenue-weighted median listed commission for the pooled top-10 rank band against ranks 11–25, 26–50 and 51–100
- 0323.8–30.1%of products in each rank band were listed at 0% commission, so medians leave out a sizeable group
- 0411 vs 12categories where the top 10 listed a higher or lower median commission than ranks 11–100, out of 29 compared
- 058% to 85.8%range of affiliate share of category revenue, from Collectibles to Baby & Maternity
- 060.95Pearson correlation across 26 categories between affiliate share and video share of revenue
Contents
Abstract
If you are deciding how much to spend testing affiliate selling on TikTok Shop, work backwards from your own margin rather than from a market-average commission rate. Our evidence includes 2,900 top products across 29 US categories and separate channel data covering 26 categories. Affiliate creators were credited with 74% of revenue in the category-channel data. The revenue-weighted median listed commission was 10% for the pooled top-10 rank band and 9% for ranks 11–100, with 23.8% to 30.1% of products in each rank band listed at 0%. These are one week of observational data without in-depth creative analysis, so they give context for a budgeting worksheet, not a default rate or a predicted return.
1. Introduction
The short answer: set your test budget from your own margin, not from a market commission rate. Work out what you can afford to pay per sale after product cost, platform fees, shipping and any paid distribution, then treat the commission as one line in that calculation. The figures here describe what top sellers list, not what you should offer, and you must supply the actual fees and costs yourself.
Commissions matter because affiliate creators are credited with most of the revenue we track, so the rate a brand offers shapes who may choose to promote its product. Prior work on affiliate marketing examines how referral fees are set and why they vary between sellers [1]. Separately, the returns to advertising are hard to measure from observational data [2], which is a reason to read the numbers below as context and not as expected results.
The question we ask is descriptive: in US TikTok Shop, how much of revenue goes through affiliates, and what commission do the top-selling products list at different ranks within their category?
2. Data
The window runs from 20 September to 19 October 2026. The marketplace figures rest on 2,900 top-selling products across 29 US categories, with each category's tracked top sellers ranked by revenue in the latest week. The evidence covers one observed week.
This paper uses sales data without in-depth creative analysis: no individual videos were analysed for it, so it says nothing about video content or format. For each category we recorded revenue split between affiliate creators, brands' own accounts and the remainder, the split across video, LIVE and the shop tab, and each product's listed commission rate and price.
These are US TikTok Shop observations, not all user-generated content everywhere. Products appear in the sample because they are top sellers, so the sample does not describe typical or new products.
Weekly category figures for the US (estimated revenue, its split between video, LIVE and the shop tab, affiliate revenue, shops and active products, and a year of weekly revenue) and daily rankings of each category’s top-selling products (unit price, commission rate, launch date and revenue by channel) were collected from several independent sources. Medians of price and commission are weighted by revenue; momentum compares the latest weeks with the same number of weeks before. This paper covers 2026-09-20 to 2026-10-19: 2,900 top-selling products across 29 categories.
3. Methods
Affiliates and own accounts: for each category we split revenue in the latest week into revenue credited to affiliate creators, revenue sold by the shops' own accounts and the remainder, alongside the category's split across video, LIVE and the shop tab. We computed Pearson correlations across categories, 26 of them in the correlation analysis, between affiliate share and video share, and between own-account share and LIVE share.
Commission by rank: within each category we ranked the tracked top sellers by revenue in the latest week and grouped them into bands (top 10, 11–25, 26–50, 51–100). For each band and for the pooled top-10 rank band against ranks 11–100 we computed the revenue-weighted median listed commission rate, leaving out products listed at 0%, which we report separately as a share of products.
Because only one week is observed, we give no uncertainty ranges and no trend. Listed rates are what products advertise, not necessarily what was paid out.
4. Results: who sells the revenue
Across categories with reported channel data, affiliate creators were credited with 74% of latest-week revenue, brands' own accounts with 11.4% and the remainder with 14.6%. Categories differed widely: affiliate share ran from 8% in Collectibles to 85.8% in Baby & Maternity, with Beauty & Personal Care at 82%, Health at 81.4% and Womenswear & Underwear at 80.8%.
Jewelry Accessories & Derivatives was the other low case, at 21.1% affiliate and 64% in the remainder, with 69.6% of its revenue through the shop tab. Collectibles had 47% from own accounts and 44% from LIVE.
Across 26 categories, affiliate share was strongly associated with video share of revenue (correlation 0.95), and own-account share was moderately associated with LIVE share (0.65). These are category-level associations from one week and say nothing about what any single brand would experience.
5. Results: commission by rank in category
The revenue-weighted median listed commission was 10% for the pooled top-10 rank band and 9% for each of the bands 11–25, 26–50 and 51–100. The gap is one percentage point, so commission levels look similar across ranks.
A sizeable share of products was listed at 0%: 23.8% of the top 10, 27.1% of ranks 11–25, 28.8% of ranks 26–50 and 30.1% of ranks 51–100. The medians exclude these, so they describe products that do offer a commission.
The top 10 accounted for 31.3% of revenue and ranks 51–100 for 27%. Revenue-weighted median price was $59 for the top 10, $43 for ranks 11–50 and about $40 for ranks 51–100, and video accounted for 79% to 81.9% of revenue in every band.
| Rank in category | Products (n) | Share of revenue | Median commission | Listed at 0% | Median price | Sold through video |
|---|---|---|---|---|---|---|
| Top 10 | 290 | 31.3% | 10% | 23.8% | $59.00 | 79% |
| 11–25 | 435 | 20.4% | 9% | 27.1% | $43.00 | 81.9% |
| 26–50 | 725 | 21.3% | 9% | 28.8% | $43.00 | 80.6% |
| 51–100 | 1,450 | 27% | 9% | 30.1% | $39.59 | 79.1% |
Note. Ranks are by revenue among each category’s tracked top-selling products in the latest week. Medians are weighted by revenue; the commission median leaves out products listed at 0%.
6. Results: top 10 against the rest, by category
Comparing each category's top 10 with ranks 11–100, the top 10 listed a higher median commission in 11 of 29 categories and a lower one in 12. The pooled one-point difference therefore does not reflect a consistent pattern within categories.
Category-level comparisons rest on fewer products, so individual category differences are thin evidence and we do not rank categories on them. The table gives the exact figures for readers who want their own category.
| Category | Top 10 median | Ranks 11–100 median | Top 10 listed at 0% |
|---|---|---|---|
| Beauty & Personal Care | 13% | 13% | 10% |
| Womenswear & Underwear | 8% | 9% | 30% |
| Health | 20% | 19% | 0% |
| Household Appliances | 5% | 5% | 30% |
| Sports & Outdoor | 7% | 8% | 0% |
| Phones & Electronics | 10% | 8% | 30% |
| Textiles & Soft Furnishings | 10% | 10% | 10% |
| Shoes | 10% | 9% | 10% |
| Home Supplies | 11% | 9% | 20% |
| Menswear & Underwear | 8% | 9% | 10% |
| Automotive & Motorcycle | 6% | 9% | 10% |
| Furniture | 8% | 6% | 0% |
| Fashion Accessories | 3% | 4% | 60% |
| Tools & Hardware | 4% | 5% | 10% |
| Toys & Hobbies | 7% | 9% | 30% |
Note. Revenue-weighted median commission rates, leaving out products listed at 0%.
7. Discussion
For a brand, the findings suggest commission is not strongly differentiated by rank: top sellers and the rest list similar medians (10% and 9%), and a large minority list 0%. We cannot say whether a higher rate attracts more creators or whether top products earned their rank by other means. Alternative explanations include product quality, price, paid promotion, creator audience size and seasonality, none of which this analysis isolates, and returns are hard to infer from observational data [2].
Recommendation, not a finding: a margin-based test plan. (1) Enter your own price, product cost, platform fees, shipping and returns allowance; none of these are supplied here. (2) Subtract them from the price to find the contribution per order before commission and paid distribution. (3) Treat the commission you offer as a share of price that must fit inside that contribution, and decide any paid-promotion spend separately. (4) Set a total test budget you are willing to lose, in your own currency, and a fixed period. (5) Write down in advance what result would make you stop, continue or change the rate. (6) Track affiliate-credited orders separately from your own account's orders. (7) Change one variable at a time, such as the commission rate, so you can read the outcome.
The market medians can serve as a reference point when checking whether an offer is unusually far from what top sellers list. They are not a default or target, and a 0% listing should not be read as a recommendation. Because categories differ sharply in channel mix, for example in the affiliate and LIVE shares, a category-specific check is worth doing first.
8. What this means for brands and founders
- Start from your own margin: in this sample the median listed commission was 10% for the pooled top-10 rank band and 9% for ranks 11–100, but use it only as a reference point beside your own price, costs and fees.
- Check your category's channel mix first: affiliate creators were credited with 74% of revenue overall, but only 8% in Collectibles and 21.1% in Jewelry Accessories & Derivatives, so an affiliate test may fit some categories better than others.
- Do not read 0% as a benchmark: between 23.8% and 30.1% of products in each rank band were listed at 0%, so decide whether a commission fits your margin before copying a competitor.
- Budget the test as a capped amount you can afford to lose, and keep paid distribution separate from commission, since observational data like this cannot show what a given rate would return.
9. Conclusion
In our separate category-channel data, affiliate creators were credited with 74% of revenue. Among the 2,900 tracked top products across 29 categories, and listed median commissions were close to each other across ranks: 10% for the top 10 and 9% below. Many products listed 0%, and affiliate share ranged from 8% to 85.8% by category.
These figures are context for a margin-based worksheet, which has to be filled in with your own costs and fees. The evidence is observational, from a single week, and drawn from top sellers only, so it supports neither a default commission rate nor a forecast of return.
Methodology
Weekly category figures for the US (estimated revenue, its split between video, LIVE and the shop tab, affiliate revenue, shops and active products, and a year of weekly revenue) and daily rankings of each category’s top-selling products (unit price, commission rate, launch date and revenue by channel) were collected from several independent sources. Medians of price and commission are weighted by revenue; momentum compares the latest weeks with the same number of weeks before. This paper covers 2026-09-20 to 2026-10-19: 2,900 top-selling products across 29 categories.
Limitations
Product figures cover the top-selling products we track in each category, not every listing, so they describe what sells best rather than everything on sale. Results are associations, not causes. Paid promotion, creator audience size and product price are not fully controlled for. Revenue, views and sales are estimates, not figures reported by TikTok. One week of data (weeksObserved 1), so there is no trend and no seasonal adjustment. The sample is top-selling products only, in US categories. Commission rates are listed rates, not confirmed payouts, and products listed at 0% are excluded from medians. Category comparisons use few products per category. No product costs, platform fees, paid promotion or creator-level data are included. No video-level creative analysis was used, and the correlations (26 categories) are associations, not causal effects.
References
- [1]Libai, B., Biyalogorsky, E., & Gerstner, E. (2003). Setting referral fees in affiliate marketing. Journal of Service Research, 5(4), 303–315.
- [2]Lewis, R. A., & Rao, J. M. (2015). The unfavorable economics of measuring the returns to advertising. The Quarterly Journal of Economics, 130(4), 1941–1973.
Cite as
MediaLabs Research, in collaboration with Coherence Limited (2026). TikTok Shop affiliate commission: setting a test budget. ContentIQ Working Paper CIQ-WP-2026-74, version 2. https://medialabs-co.com/research/tiktok-shop-affiliate-commission-guide
Analysis and data: Coherence Research, Coherence ContentIQ. Published by MediaLabs in collaboration with Coherence Limited.
Version history
- Version 219 Oct 2026This version