ContentIQ working paperCIQ-WP-2026-75TikTok ShopVersion 219 Oct 2026
Paid UGC on TikTok Shop: measuring incremental results
53,532 videos tracked, 29 categories, 20 Sept–19 Oct 2026
MediaLabs Research · in collaboration with Coherence Limited
Version 2 · updated 19 Oct 2026
Key findings
- 0166.2%of top-video revenue came from paid-led videos (80% or more paid), which were 57% of seven-day video snapshots
- 0211.8%of top-video revenue came from organic videos (under 10% paid), which were 21.1% of snapshots
- 032.33–2.42range of median ROAS across the three paid bands; attributed revenue per ad dollar, not profit
- 04$17.56 vs $16.17revenue per 1,000 views for organic versus paid-led top-selling videos
- 05159.9 vs 39likes per 1,000 views for organic versus paid-led top-selling videos
- 06$10.22–$29.87range of revenue per 1,000 views across categories, from Books, Magazines & Audio to Household Appliances
Contents
- Abstract
- 1.Introduction
- 2.Data
- 3.Methods
- 4.Results: most top-video revenue came with paid promotion
- 5.Results: attributed ROAS is similar across paid bands; engagement is not
- 6.Results: revenue per view varies about threefold by category
- 7.Discussion
- 8.What this means for brands and founders
- 9.Conclusion
- Methodology
- Limitations
- References
- Cite as
Abstract
Should a brand pay to promote creator-style video on TikTok Shop? Our analysis suggests it is worth testing, but reported return on ad spend (ROAS) cannot show whether the ads caused the sales. Paid-led videos (80% or more of revenue paid) were 57% of seven-day video snapshots and 66.2% of top-video revenue, while organic videos were 21.1% of snapshots and 11.8% of revenue. Median ROAS sat between 2.33 and 2.42 in every paid band, but this is attributed revenue per ad dollar, not profit and not incremental revenue. We propose a holdout experiment to measure incrementality, labelled as a recommendation rather than a finding.
1. Introduction
Should a brand pay to promote creator-style video on TikTok Shop? Our answer from this evidence is: treat it as a test, not an assumption. Most revenue in top-selling videos came with heavy paid promotion, but provider-estimated ROAS is an attributed figure and cannot tell you how many of those sales would have happened anyway.
This matters because brands, founders and the creators they work with must decide how much to put behind a video once it starts to sell. Measuring the returns to advertising from observational data is hard: exposed and unexposed buyers differ in ways that are not observed, so the sales that follow ads are not the sales caused by ads [1]. Attention to online content is also long-tailed, so a small share of items takes a large share of the audience [2].
This paper describes how much top-selling video revenue came with paid promotion in US TikTok Shop observations, how that varies with engagement and category, and how a brand could measure incremental results with a holdout. It does not identify which videos are user-generated or creator-made, so it speaks to top-selling video on the platform and not to all UGC everywhere. Findings are marked as such; the test plan is a recommendation.
2. Data
Our analysis covers US TikTok Shop from 20 September to 19 October 2026. 53,532 videos were tracked across 29 categories. The paid and economics figures rest on 114,194 seven-day video snapshots of 34,578 top-selling videos. Each snapshot is a daily observation of a rolling seven-day window.
Because windows overlap and videos can appear on several days, aggregated revenue is snapshot-weighted. It is not unique sales over the whole 30-day window. No videos were analysed in depth for this paper, so it uses sales data without in-depth creative analysis.
For each snapshot we recorded weekly revenue, views, likes, comments, shares, the share of revenue that came from paid promotion, estimated ROAS for paid videos, and video age. Units sold were available in only 353 snapshots, so unit and order-value figures are thin.
Daily snapshots of rolling seven-day figures for top-selling TikTok Shop videos in the US were collected from commercial data providers: each video’s estimated revenue, views and engagement, the share of its revenue and views that came from paid promotion (reported per video and top-coded at 80%), its estimated return on ad spend and its publish date. One row is one video on one observation date (a seven-day video snapshot). Adjacent windows overlap, and videos may appear repeatedly. Shares and medians describe this snapshot-weighted sample; totals are not unique sales over the publication window, and snapshots are not independent observations. This paper covers 2026-09-20 to 2026-10-19: 53,532 videos tracked.
3. Methods
Paid share is reported for each video's weekly revenue and views and is top-coded at 80%. Market and category shares weight videos by their revenue or views, so they are lower bounds on paid promotion. We call videos with under 10% of revenue paid organic, and group the rest into mixed (10–50%), mostly paid (50–80%) and paid-led (80% or more). These band thresholds are our own definitions.
ROAS is estimated revenue per dollar of ad spend, summarised by its median. It is not calculated for organic videos. It is attributed revenue before product cost, fees, shipping, returns and other expenses, so it is not profit.
Video economics use the distribution of weekly revenue per snapshot, the share of revenue taken by the top 10% and top 1% of snapshots, and revenue and engagement per 1,000 views (totals divided by total views). Concentration in a few top items is the pattern expected with long-tailed attention [2]. Category revenue through video comes from each category's weekly figures. All differences are descriptive; no causal model was fitted.
4. Results: most top-video revenue came with paid promotion
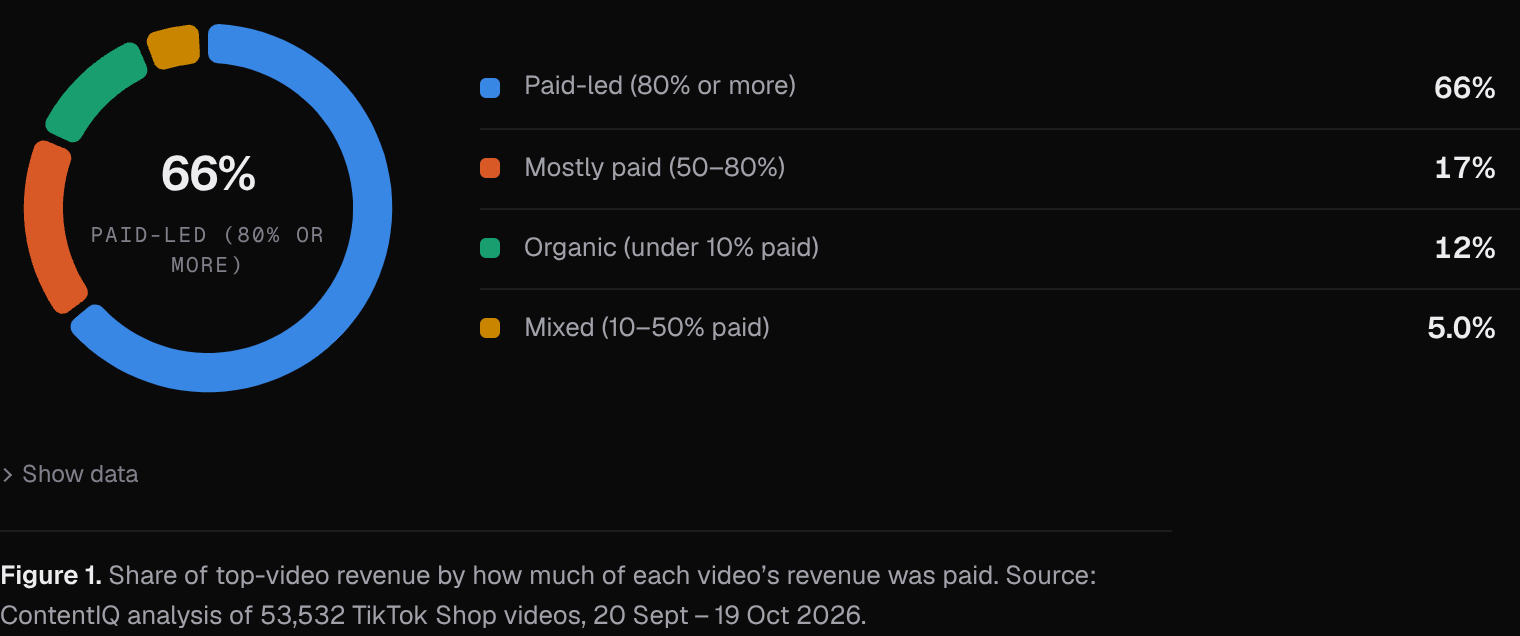
Paid-led videos (80% or more of revenue paid) were 57% of seven-day video snapshots and took 66.2% of top-video revenue. Mostly paid videos were 15.7% of snapshots and 17% of revenue, and mixed videos were 6.3% and 5%. Organic videos were 21.1% of snapshots and 11.8% of revenue.
These percentages describe each band's share of total video revenue, including any organic component. They are not the fraction of all revenue caused by ads or a measure of paid reach. Top-coding limits the underlying paid-share field. They show that in this sample top-selling video revenue was mostly accompanied by paid promotion. They do not show that paid promotion produced the revenue.
5. Results: attributed ROAS is similar across paid bands; engagement is not
Median ROAS was 2.33 for mixed, 2.42 for mostly paid and 2.35 for paid-led videos. The spread is narrow, and ROAS cannot be computed for organic videos, so there is no organic benchmark within this measure.
Revenue per 1,000 views was $17.56 for organic and $16.17 for paid-led videos. Engagement differed far more: organic videos had 159.9 likes and 17.8 shares per 1,000 views, against 39 likes and 4.9 shares for paid-led videos. Median weekly revenue per snapshot was $1,536 for organic and $3,720 for paid-led videos.
Median video age was 15 days for mostly paid videos and 31–33 days for the other bands. Age, product, budget and selection into promotion all differ between bands, so these gaps should not be read as an effect of paid promotion.
| Paid share of the video’s revenue | Video snapshots (n) | Share of revenue | Revenue per 1,000 views | Median weekly revenue | Likes per 1,000 views | Median ROAS |
|---|---|---|---|---|---|---|
| Organic (under 10% paid) | 23,445 | 11.8% | $17.56 | $1.5K | 159.9 | — |
| Mixed (10–50% paid) | 6,944 | 5% | $16.42 | $2.5K | 102.1 | 2.33× |
| Mostly paid (50–80%) | 17,405 | 17% | $17.29 | $3.3K | 46.3 | 2.42× |
| Paid-led (80% or more) | 63,283 | 66.2% | $16.17 | $3.7K | 39 | 2.35× |
Note. A video snapshot is one video’s rolling seven-day metrics on an observation date. Daily windows overlap and videos can appear repeatedly; these rows are not independent weeks or unique period sales. The paid share is reported per video and top-coded at 80%, so paid shares are lower bounds. ROAS is estimated revenue per dollar of ad spend.
6. Results: revenue per view varies about threefold by category
Across all snapshots, a top-selling video earned $16.52 per 1,000 views. Median weekly revenue per snapshot was $2,964, with a middle half of $1,190 to $6,804, a 90th percentile of $12,245 and a 99th percentile of $37,518. The top 10% of snapshots took 42.4% of revenue and the top 1% took 10.9%.
Revenue per 1,000 views ranged from $10.22 in Books, Magazines & Audio to $29.87 in Household Appliances, a ratio of about 2.9×. Furniture ($24.40), Shoes ($23.96) and Health ($22.24) were also high. The share of category revenue through video ranged from 18.8% in Jewelry Accessories & Derivatives to 79.2% in Baby & Maternity.
Category-level paid shares are not reported here, so we cannot say how paid reliance differs across categories.
7. Discussion
Attribution assigns sales to ads based on who saw and then bought. Incrementality asks how many of those sales would not have happened without the ads. In this sample, paid-led videos carried 66.2% of top-video revenue, and attributed ROAS was 2.33 to 2.42. Neither figure answers the incrementality question, because promotion tends to follow videos that already sell. That selection would inflate attributed returns even if the ads added little [1]. Organic videos show similar revenue per view ($17.56 against $16.17), which is consistent with that concern but does not establish it.
Alternative explanations include differences in product mix, price, video age, creator audience and budget between bands. Only a controlled test can separate these.
Recommendation, not a finding: a holdout test plan. (1) Pick a product with stable demand and enough sales to detect a change. (2) Before starting, write down the decision rule: the margin-based return you need, using contribution margin and not revenue. (3) Randomly split comparable audiences or regions into a group that sees paid promotion of the video and a holdout that does not, using whatever randomisation your ad tools support. (4) Keep price, creator posting, discounts and other channels as constant as possible across groups. (5) Run for a fixed period that covers a full purchase cycle, and do not stop early on a good-looking result. (6) Compare total sales per person or region in each group, including organic and other-channel sales. (7) Compare outcomes by randomly assigned group, including people who were assigned to treatment but did not see an ad. Adjust for unequal group sizes using the pre-specified design. Divide the estimated incremental revenue by incremental ad spend for incremental ROAS. Separately estimate incremental contribution after product costs, fees and returns, then deduct incremental ad spend; a revenue ratio alone is not profit. (8) Report uncertainty ranges and repeat on a second product before scaling.
8. What this means for brands and founders
- Plan for paid reach: in this sample paid-led videos (80% or more paid) took 66.2% of top-video revenue on 57% of seven-day video snapshots, so budget for paid support alongside creator content.
- Do not read ROAS as profit: median ROAS sat at 2.33 to 2.42 across paid bands, which is attributed revenue per ad dollar before costs, so test with a holdout before scaling spend.
- Check your category first: revenue per 1,000 views ranged from $10.22 in Books, Magazines & Audio to $29.87 in Household Appliances, so benchmark against your own category and not the $16.52 market figure.
- Do not judge paid creative by likes: organic videos had 159.9 likes per 1,000 views against 39 for paid-led videos, yet revenue per 1,000 views was $17.56 against $16.17.
- Expect uneven results: median weekly revenue per top video was $2,964, but the 99th percentile was $37,518, so plan for a few videos carrying most of the return.
9. Conclusion
In US TikTok Shop observations, top-selling video revenue was concentrated in videos with heavy paid promotion: 66.2% from paid-led videos on 57% of seven-day video snapshots. Attributed ROAS was similar across paid bands, at 2.33 to 2.42. Engagement and category economics differed far more.
These are observational, snapshot-weighted band statistics and do not show that paid promotion caused sales. Brands deciding whether to pay behind creator video should run a holdout test and judge it on incremental, margin-adjusted results.
Methodology
Daily snapshots of rolling seven-day figures for top-selling TikTok Shop videos in the US were collected from commercial data providers: each video’s estimated revenue, views and engagement, the share of its revenue and views that came from paid promotion (reported per video and top-coded at 80%), its estimated return on ad spend and its publish date. One row is one video on one observation date (a seven-day video snapshot). Adjacent windows overlap, and videos may appear repeatedly. Shares and medians describe this snapshot-weighted sample; totals are not unique sales over the publication window, and snapshots are not independent observations. This paper covers 2026-09-20 to 2026-10-19: 53,532 videos tracked.
Limitations
Video figures cover top-selling videos only. Daily seven-day snapshots overlap and repeat videos, so descriptive statistics weight repeated appearances; sample rows are not independent weeks and revenue totals are not unique period sales. Paid shares are reported per video and top-coded at 80%, so they are lower bounds; ad spend and margins are not observed, so a reported return on ad spend says nothing about profit. Results are associations, not causes. Paid promotion, creator audience size and product price are not fully controlled for. Revenue, views and sales are estimates, not figures reported by TikTok. These are observational US TikTok Shop data, not all UGC everywhere, and cannot show causal effects of paid promotion. Paid shares are top-coded at 80% and weighted, so they are lower bounds. ROAS is estimated, attributed and unavailable for organic videos. Figures are seven-day video snapshots with overlapping windows and repeat appearances, so revenue is snapshot-weighted and not unique sales. The 30-day window is short. Videos were not analysed in depth, so creator type and creative format are not observed. Units sold were recorded in only 353 snapshots. Category paid shares are not reported.
References
- [1]Lewis, R. A., & Rao, J. M. (2015). The unfavorable economics of measuring the returns to advertising. The Quarterly Journal of Economics, 130(4), 1941–1973.
- [2]Szabo, G., & Huberman, B. A. (2010). Predicting the popularity of online content. Communications of the ACM, 53(8), 80–88. cacm.acm.org/research/predicting-the-popularity-of-online-content
Cite as
MediaLabs Research, in collaboration with Coherence Limited (2026). Paid UGC on TikTok Shop: measuring incremental results. ContentIQ Working Paper CIQ-WP-2026-75, version 2. https://medialabs-co.com/research/tiktok-shop-paid-ugc-measurement
Analysis and data: Coherence Research, Coherence ContentIQ. Published by MediaLabs in collaboration with Coherence Limited.
Version history
- Version 219 Oct 2026This version