ContentIQ working paperCIQ-WP-2026-73TikTok ShopVersion 219 Oct 2026
TikTok Shop product launch: an evidence-led test plan
2,900 top-selling products tracked across 29 categories, 20 Sept–19 Oct 2026
MediaLabs Research · in collaboration with Coherence Limited
Version 2 · updated 19 Oct 2026
Key findings
- 0120.7%of top-seller revenue came from products launched in the last 90 days (727 products)
- 020.83×revenue per new top-seller product against the average top-seller product
- 0364.8%of new top sellers were listed at zero commission, against 12% of products launched over a year ago
- 0460.5%of Collectibles top-product revenue came from new products, against 2% in Furniture
- 0512 of 26compared categories had revenue growth above zero over the latest 13 weeks against the 13 before
Contents
Abstract
Should you launch a new product on TikTok Shop? Our analysis cannot give a probability of success, but it shows where recent launches appear among top sellers and which categories look more open. Products launched in the last 90 days earned 20.7% of top-seller revenue, with revenue per new product at 0.83× the average, and the share ranged from 2% to 60.5% across categories. The data covers only products that already reached the top, so failed launches are invisible. We therefore propose a staged test plan, labelled as a recommendation, that uses these observations to choose where to pilot and what to measure.
1. Introduction
The short answer to the launch decision: treat a TikTok Shop launch as a staged, pre-planned test rather than a single bet, and choose the pilot category with the evidence below. Our analysis cannot estimate the probability that a given launch succeeds, because it only observes products that already reached the top-seller lists.
The question matters to brands and creators because category choice, price and commission terms are set before any sales feedback arrives. Online retail is known to sell a long tail of niche products beyond the bestsellers [1], which makes newcomers plausible but says nothing about how many survive. Advertising returns are also hard to measure from observational data [2], so we describe patterns and do not claim that any tactic caused them.
This paper asks three things in US TikTok Shop observations: how much of top-seller revenue comes from recently launched products, in which categories newcomers show up, and which categories look more open to a new brand. It then turns these into a proposed test plan.
2. Data
The window runs from 20 September to 19 October 2026. The marketplace figures rest on 2,900 top-selling products across 29 categories, with 100 tracked products per category in the category breakdown. Products are grouped by launch date: the last 90 days (727 products), 90 days to a year ago (1,010) and over a year ago (1,163).
This paper uses sales data without in-depth creative analysis: no videos were tracked or analysed in depth here. Findings concern US TikTok Shop observations and not all UGC everywhere.
The opportunity score compares 26 categories, each with all four measures available. Revenue is as recorded for the latest week and the latest 13 weeks. Because only top sellers are tracked, the sample is conditional on success.
Weekly category figures for the US (estimated revenue, its split between video, LIVE and the shop tab, affiliate revenue, shops and active products, and a year of weekly revenue) and daily rankings of each category’s top-selling products (unit price, commission rate, launch date and revenue by channel) were collected from several independent sources. Medians of price and commission are weighted by revenue; momentum compares the latest weeks with the same number of weeks before. This paper covers 2026-09-20 to 2026-10-19: 2,900 top-selling products across 29 categories.
3. Methods
Opportunity score: each category receives its percentile rank among the compared categories on four measures, averaged to a 0–100 score (at least three measures needed). The measures are revenue in the latest 13 weeks against the 13 before, average revenue per shop in the latest week, openness (100 minus the top ten products’ share of revenue among tracked top sellers) and the share of top-seller revenue from products launched in the last 90 days. Openness is a simple top-ten share, related in spirit to concentration measures such as the Herfindahl–Hirschman index [3]. The score ranks categories against each other and is not a forecast.
Breakouts: within each category’s tracked top sellers in the latest week, we compare products launched in the last 90 days with older ones on share of revenue, revenue per product against the average product, share of the category’s top-10 places, and revenue-weighted median price and commission. The product-variety literature [1] is background and does not validate these custom launch thresholds.
We did not decompose seasonal patterns from trend [4], so growth figures may include seasonal movement.
4. Results: new products among top sellers
Products launched in the last 90 days made up 20.7% of top-seller revenue, against 33.6% for those launched 90 days to a year ago and 45.7% for those launched over a year ago. Revenue per new product was 0.83× the average, against 0.96× and 1.14×. New products held 67 top-10 places, against 102 and 121.
New top sellers differ in how they sell. Their revenue-weighted median price was $71.12, against $42 and $39, and 64.8% were listed at zero commission, against 21.9% and 12%. The revenue-weighted median commission was 9%, 10% and 9%. Video accounted for 62.7% of new products’ revenue against 83.9% and 84.9%, and LIVE for 20.4% against 13.6% and 13%. LIVE selling has been linked to trust and engagement in social commerce [5], but these figures show association only.
These are survivors: products that launched and reached the top. The table cannot show how many launches never got there.
| Launched | Products (n) | Share of revenue | Revenue per product vs average | Median price | Median commission | Sold on LIVE | Top-10 slots |
|---|---|---|---|---|---|---|---|
| in the last 90 days | 727 | 20.7% | 0.83× | $71.12 | 9% | 20.4% | 67 |
| 90 days to a year ago | 1,010 | 33.6% | 0.96× | $42.00 | 10% | 13.6% | 102 |
| over a year ago | 1,163 | 45.7% | 1.14× | $39.00 | 9% | 13% | 121 |
Note. Among each category’s tracked top-selling products in the latest week. Medians are weighted by revenue; the commission median leaves out products listed at 0%. Top-10 slots counts places in categories’ top tens by revenue.
5. Results: where newcomers show up by category
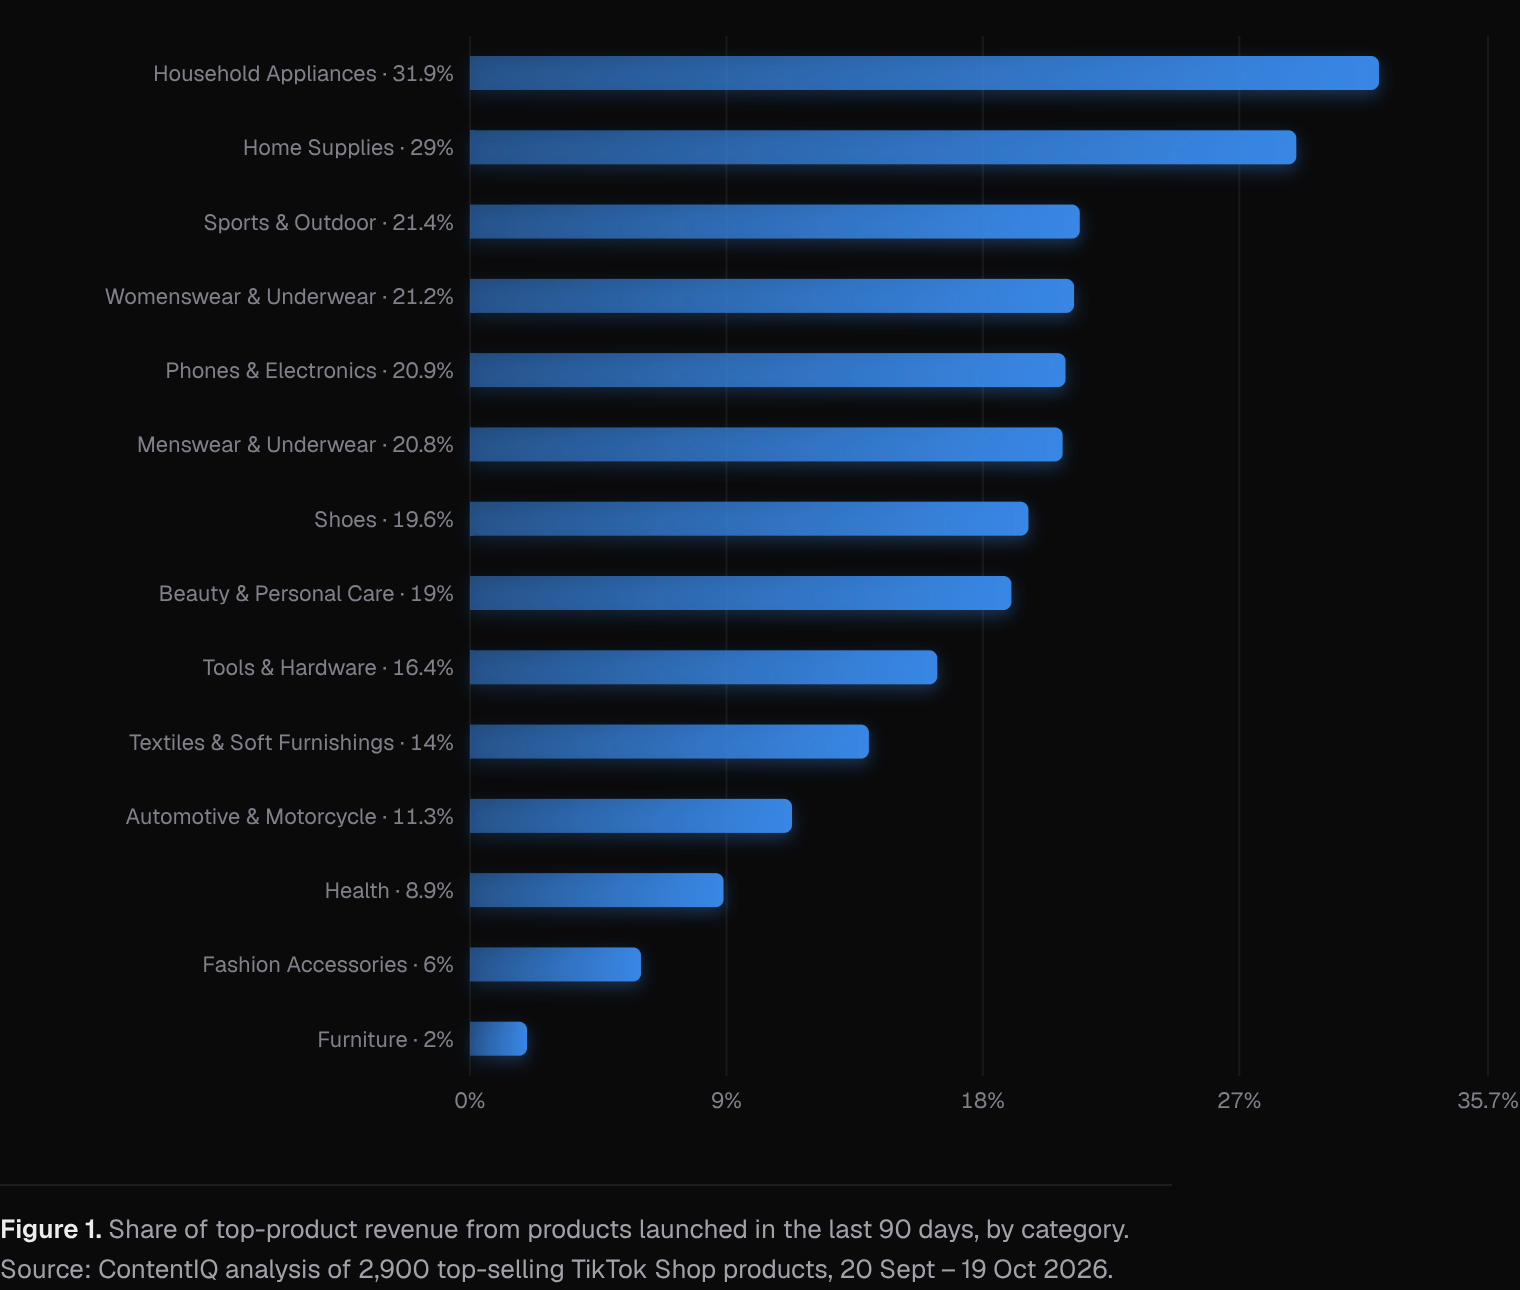
The share of top-product revenue from products launched in the last 90 days varied widely. It was 60.5% in Collectibles (63 of 100 tracked products were new) and 45.4% in Toys & Hobbies (38 new), then 32.2% in Jewelry Accessories & Derivatives, 31.9% in Household Appliances and 29% in Home Supplies. It was lowest in Furniture at 2% (3 new products), Fashion Accessories at 6% and Baby & Maternity at 6.5%.
Newcomers’ share of top-10 places also varied: 60% in Toys & Hobbies, 40% in Womenswear & Underwear, Household Appliances and Collectibles, and 0% in Health, Phones & Electronics, Furniture, Fashion Accessories and Books, Magazines & Audio. Each category has only ten top-10 places, so one product moves its share by 10 points.
A high newcomer share can mean that new launches succeed, that the category turns over quickly, or that older products fall away. Our data cannot tell these apart.
6. Results: category opportunity score
Womenswear & Underwear had the highest opportunity score (79), followed by Sports & Outdoor and Shoes (74 each) and Household Appliances (70). The lowest were Automotive & Motorcycle (20), Pet Supplies (26) and Kitchenware (27). Only 12 of the 26 compared categories had revenue growth above zero over the latest 13 weeks against the 13 before.
The components differ by category. Womenswear & Underwear had an openness of 74.3 (top-ten share 25.7%), average revenue per shop of 5,779 and 14,129 shops. Furniture had the highest revenue per shop (9,588) and growth of 5.8%, but newcomers held 2% of revenue, so its score of 61 rests on other measures. Toys & Hobbies scored 46, with growth of -27.1% over the latest 13 weeks against the 13 before but a 45.4% newcomer share.
A category with many shops can mean more competition for a new brand. The score ranks categories against each other and does not forecast what a specific launch would earn.
| Category | Score | Last 13 weeks vs 13 before | Revenue per shop (week) | Top 10 products’ share | Revenue from products under 90 days | Shops |
|---|---|---|---|---|---|---|
| Womenswear & Underwear | 79 | +3.3% | $5.8K | 25.7% | 21.2% | 14,129 |
| Sports & Outdoor | 74 | +2.9% | $2.6K | 23.7% | 21.4% | 12,965 |
| Shoes | 74 | +1.7% | $5.8K | 24.5% | 19.6% | 3,504 |
| Household Appliances | 70 | +4.6% | $5.3K | 37.3% | 31.9% | 2,842 |
| Menswear & Underwear | 66 | +0.7% | $3K | 27% | 20.8% | 7,746 |
| Collectibles | 65 | -0.6% | $3.3K | 32.1% | 60.5% | 3,651 |
| Jewelry Accessories & Derivatives | 64 | -2.2% | $5.1K | 29.8% | 32.2% | 1,312 |
| Furniture | 61 | +5.8% | $9.6K | 31.3% | 2% | 1,912 |
| Health | 59 | -0.2% | $6.5K | 27.1% | 8.9% | 3,746 |
| Tools & Hardware | 59 | +2.6% | $2.6K | 28.6% | 16.4% | 4,939 |
| Beauty & Personal Care | 57 | +0.2% | $6K | 33.1% | 19% | 16,116 |
| Fashion Accessories | 54 | +0.9% | $2.2K | 20% | 6% | 12,941 |
| Home Supplies | 49 | -6.6% | $1.3K | 24.5% | 29% | 18,519 |
| Luggage & Bags | 49 | -4.2% | $1.9K | 28.2% | 22.7% | 3,877 |
| Phones & Electronics | 48 | -5.3% | $2.7K | 29.2% | 20.9% | 8,923 |
Note. The score averages each category’s percentile rank on four measures (needs at least three): momentum, revenue per shop, openness (100 minus the top ten products’ share of top-product revenue) and the share of top-product revenue from products launched in the last 90 days. It ranks categories against each other; it is not a forecast.
7. Discussion
Newcomers earned a meaningful slice of top-seller revenue (20.7%) but less per product than the average (0.83×). Prior work on long-tail retail [1] fits the first point. The second is consistent with newer products being earlier on the path to scale, though we cannot test that. Some 64.8% of new top sellers were listed at zero commission. This does not establish the seller's strategy, negotiated terms, or whether creators actually received no commission. Affiliate-fee theory [6] is background; we cannot infer a recruitment mechanism from this field.
Alternative explanations are many: survivorship, since failed launches are absent; seasonality as Q4 approaches; category turnover; brand transfers from other channels; and promotion we cannot see. Observational returns to promotion are hard to isolate [2]. We do not estimate a launch success probability.
Recommendation (not a finding): a staged test plan. 1) Shortlist two or three categories using the opportunity score, newcomer share and growth, and note that the score is relative. 2) Before listing, write down the metric you will judge on, such as revenue per day, orders, return rate and margin after commission, and a decision rule to stop, hold or scale. 3) Set price and commission as deliberate test variables, citing the observed medians ($71.12 and 9% for new top sellers) only as context. 4) Pilot with a small inventory and compare video, LIVE and creator-led routes separately. 5) Review against your own pre-set rule, record failures as well as wins, and keep a log so you build the survivorship-free evidence this data lacks.
8. What this means for brands and founders
- Set modest expectations for a new listing: new top sellers earned 0.83× the revenue of the average top-seller product, so a launch that reaches the top is associated with less revenue than established ones.
- Check newcomer room in your category before committing stock: products launched in the last 90 days held 60.5% of Collectibles top-product revenue but 2% in Furniture.
- Test commission as a variable: 64.8% of new top sellers were listed at zero commission, against 12% of products launched over a year ago, though this shows association only.
- Plan for LIVE alongside video: LIVE made up 20.4% of new top-seller revenue against 13% for products launched over a year ago, while video made up 62.7% against 84.9%.
- Use the opportunity score to shortlist pilot categories, not to forecast: Womenswear & Underwear scored 79 and Automotive & Motorcycle 20 on a relative 0–100 scale.
9. Conclusion
Recently launched products are visible among TikTok Shop top sellers (20.7% of revenue, 727 products), but at 0.83× the average revenue per product and with large differences by category (2% to 60.5%). Categories also differ on openness and growth, with Womenswear & Underwear, Sports & Outdoor and Shoes scoring highest on our relative measure.
Because the data contains only products that reached the top, it cannot give a probability that a launch succeeds. The sensible use of this evidence is to pick where to pilot and to design a measured test, not to forecast results.
Methodology
Weekly category figures for the US (estimated revenue, its split between video, LIVE and the shop tab, affiliate revenue, shops and active products, and a year of weekly revenue) and daily rankings of each category’s top-selling products (unit price, commission rate, launch date and revenue by channel) were collected from several independent sources. Medians of price and commission are weighted by revenue; momentum compares the latest weeks with the same number of weeks before. This paper covers 2026-09-20 to 2026-10-19: 2,900 top-selling products across 29 categories.
Limitations
Product figures cover the top-selling products we track in each category, not every listing, so they describe what sells best rather than everything on sale. Results are associations, not causes. Paid promotion, creator audience size and product price are not fully controlled for. Revenue, views and sales are estimates, not figures reported by TikTok. The data covers only products that reached the top-seller lists, so launches that failed or stalled are not observed (survivorship bias), and no launch success probability can be derived. Category figures rest on 100 tracked products per category, and some top-10 shares move by 10 points with one product. Launch date is as recorded; revenue is a one-week view for breakouts and 13-week comparisons for growth, with no seasonal adjustment, and Q4 effects may be present. The opportunity score compares 26 of 29 categories and ranks them against each other. There is no cost, margin, return or ad-spend data, and these are US TikTok Shop observations, not all UGC everywhere. No videos were analysed in depth for this paper.
References
- [1]Brynjolfsson, E., Hu, Y. J., & Smith, M. D. (2003). Consumer surplus in the digital economy: Estimating the value of increased product variety at online booksellers. Management Science, 49(11), 1580–1596.
- [2]Lewis, R. A., & Rao, J. M. (2015). The unfavorable economics of measuring the returns to advertising. The Quarterly Journal of Economics, 130(4), 1941–1973.
- [3]Rhoades, S. A. (1993). The Herfindahl–Hirschman index. Federal Reserve Bulletin, 79, 188–189.
- [4]Cleveland, R. B., Cleveland, W. S., McRae, J. E., & Terpenning, I. (1990). STL: A seasonal-trend decomposition procedure based on loess. Journal of Official Statistics, 6(1), 3–73.
- [5]Wongkitrungrueng, A., & Assarut, N. (2020). The role of live streaming in building consumer trust and engagement with social commerce sellers. Journal of Business Research, 117, 543–556.
- [6]Libai, B., Biyalogorsky, E., & Gerstner, E. (2003). Setting referral fees in affiliate marketing. Journal of Service Research, 5(4), 303–315.
Cite as
MediaLabs Research, in collaboration with Coherence Limited (2026). TikTok Shop product launch: an evidence-led test plan. ContentIQ Working Paper CIQ-WP-2026-73, version 2. https://medialabs-co.com/research/tiktok-shop-product-launch-plan
Analysis and data: Coherence Research, Coherence ContentIQ. Published by MediaLabs in collaboration with Coherence Limited.
Version history
- Version 219 Oct 2026This version