ContentIQ working paperCIQ-WP-2026-72TikTok ShopVersion 118 Oct 2026
TikTok Shop holiday content: planning seasonal UGC
51,843 videos tracked, 9,411 analysed in depth, 29 categories, 19 Sept–18 Oct 2026
MediaLabs Research · in collaboration with Coherence Limited
Key findings
- 010.86×sales per view for gifting-angle videos against the market (90% range 0.80–0.93; 270 videos)
- 021.35×sales per view for urgency or scarcity angles (90% range 1.2–1.5), with value or deal angles at 1.26×
- 0336%share of watched-video sales from demo or tutorial videos, which sold at 0.96× per view (range 0.94–0.99)
- 041.23× vs 0.81×Pre-Owned against Toys & Hobbies in last year's Black Friday / Cyber Monday months, relative to a normal month
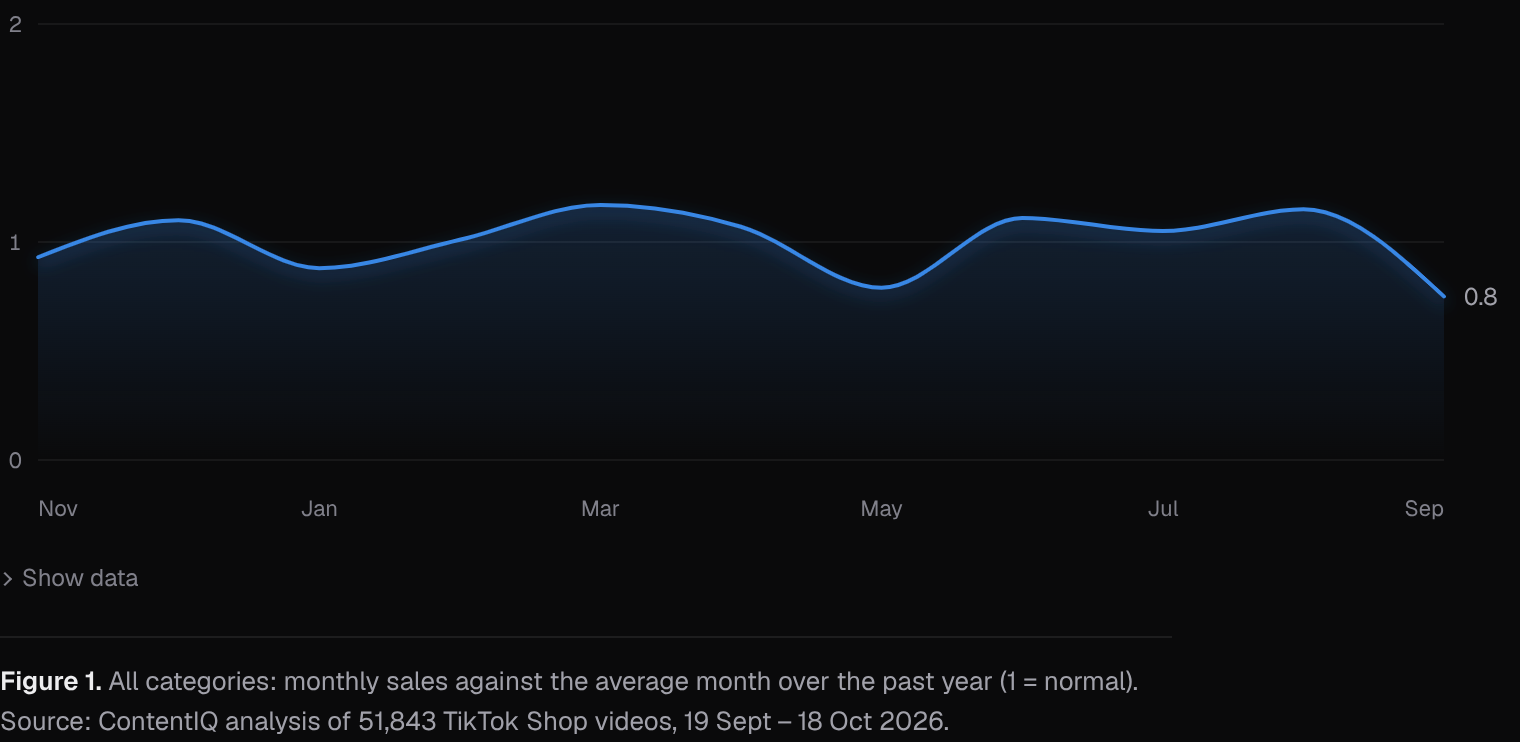
- 051.10×all-category sales in December 2025 against a normal month, after 0.93× in November 2025
Contents
Abstract
Should brands build holiday UGC around a gifting theme or around product demos? Our analysis of US TikTok Shop finds no case for assuming either works. Last year's November–December sales were above a normal month in some categories (Pre-Owned 1.23×) and below in others (Toys & Hobbies 0.81×). In the weeks before the season, gifting-angle videos sold at 0.86× the market's sales per view (90% range 0.80–0.93), while urgency and value or deal angles sold at 1.35× and 1.26×. These are observational patterns from one year of seasonal history and a 30-day video window, so we frame holiday content as a set of small, labelled tests rather than a prediction.
1. Introduction
Short answer for a brand deciding what to film for the holidays: treat gift and product-demo content as tests, not defaults. In our data, last year's November–December sales varied widely by category, from 1.23× a normal month for Pre-Owned to 0.81× for Toys & Hobbies. In the 30 days before the gifting season, videos with a gifting angle sold at 0.86× the market's sales per view (90% range 0.80–0.93), below average. Everything below that describes past outcomes is an observation. Anything about what to film is a proposal, and we label it.
The question matters because holiday production has to be commissioned weeks ahead. Our internal planning windows begin on 10 November for Black Friday / Cyber Monday content and 15 November for holiday gifting. These are analytical planning windows, not official event dates or platform campaign schedules. Creators working on these briefs need to know which framings have tended to sell and where the evidence is thin.
Prior work gives two cautions. Seasonal patterns have to be separated from underlying trend before they are read as seasonality [1]. Returns to advertising are hard to measure from observational data [2]. We therefore report associations with ranges and avoid causal claims. These are observations of US TikTok Shop, not of all UGC everywhere.
2. Data
The window runs from 19 September to 18 October 2026. We tracked 51,843 videos, and our AI analyst watched and analysed 9,411 of them in depth. The sample spans 29 categories; the seasonal evidence rests on 28 of them. Format and angle statistics come from the analysed videos and show each group's video count and share of watched-video sales.
For seasonality we use each category's monthly revenue over the past year, including the same months last year as the retail moments (Halloween, Black Friday / Cyber Monday, holiday gifting and New Year resolutions). We have one year of history, so each month is a single observation.
The data do not include the creative brief behind each video, the offer, the price or the spend, and we cannot separate organic from paid reach here.
Daily rankings of top-selling TikTok Shop videos in the US were collected from several independent sources and merged into one record per video. Where sources overlap, their sales estimates are cross-checked against each other, and videos whose estimates disagree by more than half are flagged. An AI analyst watched each video and recorded its opening, format, angle, production style, use of AI, hook source, length, pacing, what appears in the first second and how it is presented (people on screen, voice-over, setting, UGC or studio feel), without seeing how the video sold. Sales per view is a video group’s revenue per view divided by the market’s, shrunk toward the average for small groups, with 90% ranges. Weekly category figures for the US (estimated revenue, its split between video, LIVE and the shop tab, affiliate revenue, shops and active products, and a year of weekly revenue) and daily rankings of each category’s top-selling products (unit price, commission rate, launch date and revenue by channel) were collected from several independent sources. Medians of price and commission are weighted by revenue; momentum compares the latest weeks with the same number of weeks before. This paper covers 2026-09-19 to 2026-10-18: 51,843 videos tracked, 9,411 of them watched and analysed.
3. Methods
Sales per view is a group's revenue per view divided by the whole market's, so 1 is the market average. Estimates for small groups are shrunk toward the average by empirical Bayes [3], and 90% intervals are computed on the log scale. We label each group's confidence; groups with few videos are marked medium and should be read as indicative.
Seasonality compares each month's revenue with the category's average month over the past year, so 1 means a normal month. The partial first and last months are left out. STL [1] is background on separating season from trend; these simple ratios do not implement a seasonal-trend decomposition. With only one year of data, the ratios still carry any trend that ran through the year.
A retail moment's category figures are the ratios for its calendar months. Black Friday / Cyber Monday and holiday gifting both map to November and December, so they share the same figures and cannot be told apart.
4. Results: seasonal timing by category
Across all categories, December 2025 sold at 1.10× a normal month and November 2025 at 0.93×. January 2026 fell to 0.88×. Outside the holidays the swings were also large: March 1.17×, May 0.79× and September 2026 0.75×. A holiday month is therefore not clearly separable from ordinary month-to-month variation.
Categories differed more than the market. In last year's November–December months, Pre-Owned sold at 1.23× a normal month, Menswear & Underwear 1.11×, Kids' Fashion 1.10× and Textiles & Soft Furnishings 1.08×. Household Appliances sold at 0.93× and Toys & Hobbies at 0.81×.
The Halloween months (September–October) were mostly below normal. The highest were Muslim Fashion at 1.01× and Collectibles at 1.00×. Toys & Hobbies sold at 0.66×, Furniture and Kids' Fashion at 0.65× and Household Appliances at 0.61×. In the New Year months, Collectibles was 1.09× and Menswear & Underwear 0.74×. Kids' Fashion moved from 0.65× at Halloween to 1.10× in November–December.
5. Results: which formats sold per view
Demo or tutorial videos were the largest group, with 3,202 videos and 36% of watched-video sales. They sold at 0.96× the market's sales per view (90% range 0.94–0.99), slightly below average. Review or testimonial videos (1,085 videos, 14.1% of sales) sold at 1.17× (1.12–1.22). Unboxing videos (313 videos, 3.2%) sold at 1.20× (1.10–1.32). Voice-over B-roll (569 videos, 5.8%) sold at 1.23× (1.15–1.32).
Skits sold at 0.89× (0.82–0.96) across 443 videos. Day in the life (16 videos, range 0.86–2.21) and Live clip (37 videos, range 0.82–1.68) have estimates above 1.1× but ranges that include the market average, so we do not draw conclusions from them.
These rates are for all videos in the window, not only holiday videos. They describe how formats sold before the season began, and they do not show how a gift-themed demo or unboxing would sell in December.
| Value | Videos (n) | Share of sales | Sales per view | 90% range |
|---|---|---|---|---|
| Day in the life | 16 | 0.1% | 1.38× | 0.86–2.21 |
| Voice-over B-roll | 569 | 5.8% | 1.23× | 1.15–1.32 |
| Unboxing | 313 | 3.2% | 1.20× | 1.10–1.32 |
| Live clip | 37 | 0.4% | 1.17× | 0.82–1.68 |
| Review or testimonial | 1,085 | 14.1% | 1.17× | 1.12–1.22 |
| Talking head | 1,009 | 12.1% | 1.10× | 1.05–1.16 |
| Comparison | 262 | 4% | 1.09× | 0.99–1.19 |
| Green screen | 68 | 0.8% | 1.06× | 0.84–1.33 |
| Routine / GRWM | 321 | 3.7% | 1.00× | 0.93–1.09 |
| Demo or tutorial | 3,202 | 36% | 0.96× | 0.94–0.99 |
Note. Sales per view is relative to the market (1.00 = average), shrunk toward the average for small groups (empirical Bayes); ranges are 90% intervals on the log scale.
6. Results: which angles sold per view
Urgency or scarcity angles sold at 1.35× the market's sales per view (90% range 1.2–1.5) across 240 videos, with 2.9% of sales. Value or deal angles sold at 1.26× (1.21–1.32), with 1,344 videos and 15.8% of sales. Social proof sold at 1.21× (1.10–1.33) and education at 1.18× (1.05–1.32).
The angles most relevant to the holidays sold below average. Gifting (270 videos, 3.4% of sales) sold at 0.86× (0.80–0.93), and Seasonal moment (581 videos, 6.7%) at 0.92× (0.87–0.98). Curiosity sold at 0.71× (0.65–0.77), the lowest.
Two cautions apply. This window ended before the main gifting period, so the gifting result may not carry into late November and December. A gifting label also says nothing about the offer, price or reach behind a video, which may explain part of the gap.
| Value | Videos (n) | Share of sales | Sales per view | 90% range |
|---|---|---|---|---|
| Urgency or scarcity | 240 | 2.9% | 1.35× | 1.22–1.50 |
| Value or deal | 1,344 | 15.8% | 1.26× | 1.21–1.32 |
| Social proof | 234 | 3% | 1.21× | 1.10–1.33 |
| Education | 226 | 2.2% | 1.18× | 1.05–1.32 |
| Lifestyle / aspiration | 836 | 8.5% | 1.03× | 0.97–1.09 |
| Convenience / time saved | 819 | 7.6% | 1.01× | 0.96–1.07 |
| Problem → solution | 2,608 | 33.4% | 0.98× | 0.95–1.00 |
| Transformation | 656 | 9.3% | 0.96× | 0.91–1.02 |
| Seasonal moment | 581 | 6.7% | 0.92× | 0.87–0.97 |
| Humour | 143 | 1.9% | 0.89× | 0.77–1.02 |
Note. Sales per view is relative to the market (1.00 = average), shrunk toward the average for small groups (empirical Bayes); ranges are 90% intervals on the log scale.
7. Discussion
The seasonal evidence supports a category-first reading. A brand in Pre-Owned, Menswear & Underwear or Kids' Fashion faces a different November–December than one in Toys & Hobbies or Household Appliances, so a single holiday brief is a poor fit. The gifting angle selling below average per view is not evidence that gifting content fails. It may reflect when the window fell, which products used the label, or the reach those videos had. Alternative explanations include price, offers, creator size and paid promotion, none of which we can isolate. Because each month is one observation from a single year, some of what looks seasonal may be trend [1]. Observational data of this kind also cannot establish the returns to advertising [2].
The format and angle results suggest what to compare. Unboxing and review videos sold above average per view, and demos carried the most volume but sold slightly below average. Value and urgency angles had the highest rates. Whether those patterns hold for holiday gift products is untested.
Recommendation, not a finding: a proposed test plan. (1) Look up your category's November–December and January ratios and set your effort by them. (2) For each product you plan to feature, make two variants with the same creator, offer and product: a gift-framed version and a plain demo or unboxing version. (3) Add a value or urgency variant only where a real deadline or discount exists, and do not invent scarcity. (4) Write down in advance the hypothesis, the number of videos per variant, the paid budget and how long you will wait. (5) Compare sales per view across variants rather than total sales, and keep paid promotion consistent between them. (6) Decide the stop or scale rule before launch, and treat a result from a handful of videos as indicative only. Check current platform rules and disclosure requirements separately.
8. What this means for brands and founders
- Check your category's seasonal curve before briefing creators: in last year's November–December months Toys & Hobbies sold at 0.81× a normal month while Pre-Owned sold at 1.23×.
- Test gifting as a framing rather than assuming it lifts sales: gifting-angle videos sold at 0.86× the market's sales per view (90% range 0.80–0.93) in the weeks before the season.
- Run a gift-framed and a plain version of the same demo or unboxing: unboxing sold at 1.20× per view (range 1.10–1.32) and demos at 0.96× while holding 36% of sales.
- Use value or urgency framing only where the offer is real: value or deal angles sold at 1.26× and urgency or scarcity at 1.35× the market's sales per view (ranges 1.21–1.32 and 1.2–1.5).
- Treat a January lift in apparel and footwear as an unproven hypothesis: last January Menswear & Underwear sold at 0.74× a normal month and Shoes at 0.75×.
9. Conclusion
In US TikTok Shop data, the holiday opportunity depends on the category: last year's November–December sales ranged from 1.23× a normal month to 0.81×. In the 30 days before the season, gifting and seasonal-moment angles sold below the market's sales per view (0.86× and 0.92×), while urgency and value or deal angles sold above it (1.35× and 1.26×). Unboxing and review formats sold above average, and demos carried the largest share of sales at 0.96× per view.
These are associations from one year of seasonal history and a 30-day window, and they do not show that any creative will work in December. The practical response is a small, pre-registered test of gift-framed against plain demo content, read against the category's seasonal curve.
Methodology
Daily rankings of top-selling TikTok Shop videos in the US were collected from several independent sources and merged into one record per video. Where sources overlap, their sales estimates are cross-checked against each other, and videos whose estimates disagree by more than half are flagged. An AI analyst watched each video and recorded its opening, format, angle, production style, use of AI, hook source, length, pacing, what appears in the first second and how it is presented (people on screen, voice-over, setting, UGC or studio feel), without seeing how the video sold. Sales per view is a video group’s revenue per view divided by the market’s, shrunk toward the average for small groups, with 90% ranges. Weekly category figures for the US (estimated revenue, its split between video, LIVE and the shop tab, affiliate revenue, shops and active products, and a year of weekly revenue) and daily rankings of each category’s top-selling products (unit price, commission rate, launch date and revenue by channel) were collected from several independent sources. Medians of price and commission are weighted by revenue; momentum compares the latest weeks with the same number of weeks before. This paper covers 2026-09-19 to 2026-10-18: 51,843 videos tracked, 9,411 of them watched and analysed.
Limitations
Most videos in the sample are top-ranked, so findings mostly separate strong sellers from good ones rather than from all videos; typical and weak videos are being added. Product figures cover the top-selling products we track in each category, not every listing, so they describe what sells best rather than everything on sale. Results are associations, not causes. Paid promotion, creator audience size and product price are not fully controlled for. Revenue, views and sales are estimates, not figures reported by TikTok. Seasonal ratios rest on one year of history, so each month is a single observation and trend is not fully separated from season. Black Friday / Cyber Monday and holiday gifting share the same November–December figures. The video window (19 Sept–18 Oct 2026) ends before the main gifting period, so format and angle rates may differ in November and December. Day in the life (16 videos) and Live clip (37 videos) are thin, with wide ranges. The sample lists 29 categories while the seasonal evidence covers 28. We cannot see offers, prices, spend, paid promotion or creator size, and everything is correlational. September 2026's 0.75× market ratio should be read with care given large swings in other months. Findings are for US TikTok Shop only.
References
- [1]Cleveland, R. B., Cleveland, W. S., McRae, J. E., & Terpenning, I. (1990). STL: A seasonal-trend decomposition procedure based on loess. Journal of Official Statistics, 6(1), 3–73.
- [2]Lewis, R. A., & Rao, J. M. (2015). The unfavorable economics of measuring the returns to advertising. The Quarterly Journal of Economics, 130(4), 1941–1973.
- [3]Efron, B., & Morris, C. (1975). Data analysis using Stein’s estimator and its generalizations. Journal of the American Statistical Association, 70(350), 311–319.
Cite as
MediaLabs Research, in collaboration with Coherence Limited (2026). TikTok Shop holiday content: planning seasonal UGC. ContentIQ Working Paper CIQ-WP-2026-72, version 1. https://medialabs-co.com/research/tiktok-shop-holiday-content
Analysis and data: Coherence Research, Coherence ContentIQ. Published by MediaLabs in collaboration with Coherence Limited.
Version history
- Version 118 Oct 2026This version