ContentIQ working paperCIQ-WP-2026-58TikTok ShopVersion 118 Oct 2026
TikTok Shop agency audit: questions to ask about results
51,843 videos tracked across 29 categories, 19 Sept–18 Oct 2026 (US TikTok Shop)
MediaLabs Research · in collaboration with Coherence Limited
Key findings
- 0166.4%of top-video revenue came with paid promotion (a lower bound), against 16.1% of views
- 022.37median estimated ROAS of paid video snapshots (middle half 1.95–2.81); 27.7% had a ROAS under 2
- 03$17.06 vs $16.02revenue per 1,000 views for organic versus paid-led videos, so paid-led videos did not sell more per view
- 041.94–2.91range of median ROAS across categories, from Jewelry Accessories & Derivatives to Beauty & Personal Care
- 0520.1%–45.3%share of top-product revenue taken by the ten biggest products, from Fashion Accessories to Baby & Maternity
Contents
- Abstract
- 1.Introduction
- 2.Data
- 3.Methods
- 4.Results: paid promotion carries most top-video revenue
- 5.Results: ROAS varies by category and is attributed, not incremental
- 6.Results: concentration differs sharply by category
- 7.Discussion
- 8.What this means for brands and founders
- 9.Conclusion
- Methodology
- Limitations
- References
- Cite as
Abstract
We analysed top-selling TikTok Shop videos and category competition to set out what an agency's results report should show. Paid promotion accounted for at least 66.4% of top-video revenue on 16.1% of views, and median estimated return on ad spend (ROAS) was 2.37 (middle half 1.95–2.81). Revenue per 1,000 views was similar for organic and paid-led videos ($17.06 and $16.02), and the top ten products took between 20.1% and 45.3% of tracked top-product revenue depending on category. These are attributed figures from public top-seller data, not incremental effects, so we list the account data an audit still needs and propose a test plan.
1. Introduction
The short answer for a brand deciding whether to hire or keep a TikTok Shop agency: judge the agency on whether its reports separate attributed revenue from incremental revenue, show how much revenue depends on paid promotion, and show how concentrated sales are in a few products or creatives. A report that gives only total revenue or a single ROAS cannot answer those questions. This paper gives benchmarks for each from public top-seller data and lists what further account data an audit needs.
The question matters because paid promotion is a large part of what top videos earn. Observational data struggle to show what advertising causes: returns to advertising are hard to measure without experiments, because people who see ads differ from those who do not [1]. A reported ROAS is therefore a starting point for questions, not proof of return. Concentration matters too. Attention to online content is long-tailed [2], and a few products can carry a category [3].
Our evidence covers US TikTok Shop top-selling videos and categories. It is not a measure of UGC everywhere, and it does not observe any single brand's account. Every recommendation below is labelled as such and is separate from the measured findings.
2. Data
The window runs from 19 September to 18 October 2026. We tracked 51,843 videos across 29 categories. This paper does not use in-depth creative analysis, so nothing here relies on creative content analysis. The paid-promotion analysis uses 33,825 videos observed over 110,867 video snapshots.
For each top-selling video snapshot we have revenue, views, engagement per 1,000 views, video age, and the share of revenue that came from paid promotion. Where paid promotion is present we also have estimated ROAS. For categories we have shops, active products, average revenue per shop in the latest week (as of 12 October 2026), and concentration among tracked top-selling products.
The data cover top sellers only. Videos that sold little are not in the sample, so the figures describe successful videos and cannot show how often a given approach fails.
Weekly figures for the top-selling TikTok Shop videos in the US were collected from commercial data providers: each video’s estimated revenue, views and engagement in each week it ranked, the share of its revenue and views that came from paid promotion (reported per video and top-coded at 80%), its estimated return on ad spend and its publish date. One row is one video on one observation date (a video snapshot). Weekly category figures for the US (estimated revenue, its split between video, LIVE and the shop tab, affiliate revenue, shops and active products, and a year of weekly revenue) and daily rankings of each category’s top-selling products (unit price, commission rate, launch date and revenue by channel) were collected from several independent sources. Medians of price and commission are weighted by revenue; momentum compares the latest weeks with the same number of weeks before. This paper covers 2026-09-19 to 2026-10-18: 51,843 videos tracked.
Daily seven-day video snapshots can overlap and repeat the same video. Counts are observations, not independent weeks. Aggregate shares and medians are snapshot-weighted; summed revenue is not unique sales over the publication window.
3. Methods
Paid share: each video snapshot carries the share of its revenue that came from paid promotion, reported per video and top-coded at 80%. Market and category shares weight videos by their revenue (or views), so they are lower bounds. Videos with under 10% of revenue paid are called organic. ROAS is estimated revenue per dollar of ad spend, summarised by its median and middle half (the 25th to 75th percentile). These are not 90% intervals. The difficulty of reading such figures causally is why we use association language throughout [1].
Competition: shops and active products per category in the latest week, average revenue per shop, and concentration among tracked top-selling products. Concentration is the top ten products' share and the Herfindahl–Hirschman index (HHI), the sum of squared shares [3]. Higher values mean revenue sits with fewer products.
We did not fit a predictive model for this paper. No statistic here separates attributed from incremental revenue, because that needs holdouts or account data that we do not observe.
4. Results: paid promotion carries most top-video revenue
Paid promotion accounted for at least 66.4% of top-video revenue but 16.1% of views. Both are lower bounds, because 56.8% of video snapshots were top-coded at 80% paid. Paid-led videos (80% or more paid) were 56.8% of video snapshots and 65.9% of revenue. Organic videos (under 10% paid) were 21% of video snapshots and 11.9% of revenue.
Per view, the bands look alike: revenue per 1,000 views was $17.06 for organic, $16.12 for mixed, $16.94 for mostly paid and $16.02 for paid-led videos. Median weekly revenue rose with paid share, from $1,550 (organic) to $3,685 (paid-led). Organic videos had more likes per 1,000 views (148.8 against 37.3) and more shares (16.5 against 4.7). Median video age was 30 days for organic and 13 days for mostly paid. Paid-led videos had a median of 28 days.
This is association, not effect. Larger weekly revenue in paid-led videos may reflect more reach bought, not better selling per view. Whether paid reach added sales that would not have happened anyway cannot be read from this table.
| Paid share of the video’s revenue | video snapshots (n) | Share of revenue | Revenue per 1,000 views | Median weekly revenue | Likes per 1,000 views | Median ROAS |
|---|---|---|---|---|---|---|
| Organic (under 10% paid) | 23,310 | 11.9% | $17.06 | $1.6K | 148.8 | — |
| Mixed (10–50% paid) | 6,933 | 5% | $16.12 | $2.5K | 96.2 | 2.34× |
| Mostly paid (50–80%) | 17,688 | 17.2% | $16.94 | $3.3K | 43.8 | 2.43× |
| Paid-led (80% or more) | 62,936 | 65.9% | $16.02 | $3.7K | 37.3 | 2.36× |
Note. A video snapshot is one video’s rolling seven-day metrics on an observation date. The paid share is reported per video and top-coded at 80%, so paid shares are lower bounds. ROAS is estimated revenue per dollar of ad spend.
5. Results: ROAS varies by category and is attributed, not incremental
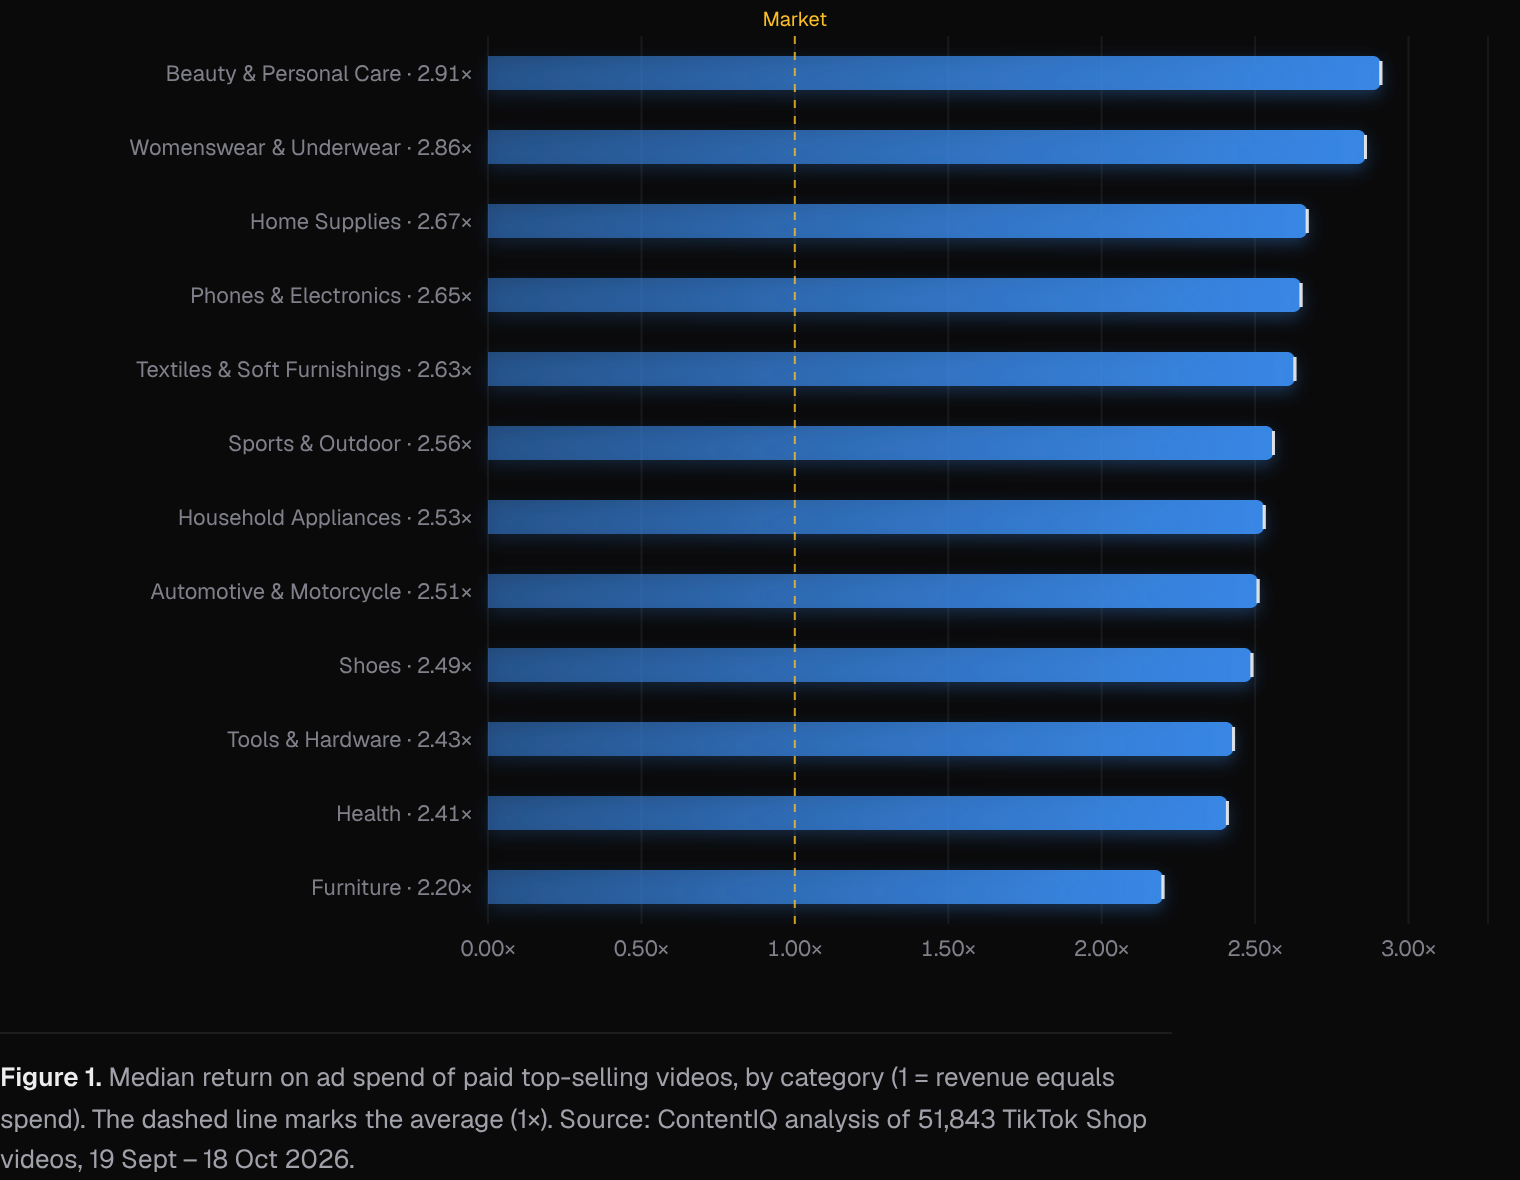
Across paid video snapshots the median estimated ROAS was 2.37, with a middle half of 1.95 to 2.81. About 27.7% of paid video snapshots had a ROAS under 2. Whether a given ROAS is profitable depends on margins, which we do not observe.
Categories differed. Median ROAS was highest in Beauty & Personal Care (2.91, middle half 2.39–3.28) and Womenswear & Underwear (2.86, 2.53–3.15). It was lowest in Jewelry Accessories & Derivatives (1.94, 1.60–2.32) and Baby & Maternity (1.96, 1.66–2.29). The paid share of revenue ranged from 51.6% in Kids' Fashion to 72.4% in Household Appliances. Comparing a brand's ROAS with the market median without checking its category could mislead in either direction.
Revenue per 1,000 views for organic versus paid-led videos did not point one way. Organic was higher in Household Appliances ($38.91 against $28.98) and Furniture ($33.34 against $23.27). Paid-led was higher in Baby & Maternity ($22.87 against $12.73). Some categories have few video snapshots, so single-category gaps should be read with caution.
6. Results: concentration differs sharply by category
Among tracked top-selling products, the ten biggest took 45.3% of revenue in Baby & Maternity and 44% in Textiles & Soft Furnishings. In Fashion Accessories they took 20.1%. The HHI was highest in Automotive & Motorcycle (374) and Textiles & Soft Furnishings (354), and lowest in Fashion Accessories (117).
Shop counts and revenue per shop also varied. Furniture averaged $9,474 per shop in the latest week across 1,916 shops. Computers & Office Equipment averaged $1,087 across 6,627 shops, and Home Supplies $1,276 across 18,566 shops. Beauty & Personal Care had 16,040 shops and 123,940 active products.
These measures describe a category's top products, not any one brand's reliance on its own best sellers. Concentration inside an account has to be calculated from the account's own data.
| Category | Shops | Active products | Revenue per shop | Top 10 products’ share |
|---|---|---|---|---|
| Beauty & Personal Care | 16,040 | 123,940 | $5.9K | 35.2% |
| Womenswear & Underwear | 14,131 | 161,641 | $5.5K | 25.4% |
| Sports & Outdoor | 12,972 | 95,535 | $2.6K | 23.2% |
| Fashion Accessories | 13,066 | 115,861 | $2.1K | 20.1% |
| Phones & Electronics | 9,018 | 67,209 | $2.8K | 29.7% |
| Health | 3,752 | 19,106 | $6.3K | 28% |
| Home Supplies | 18,566 | 98,913 | $1.3K | 26.2% |
| Menswear & Underwear | 7,734 | 89,135 | $2.8K | 26.9% |
| Shoes | 3,508 | 33,530 | $5.6K | 25.1% |
| Furniture | 1,916 | 15,692 | $9.5K | 30.9% |
| Household Appliances | 2,830 | 10,789 | $6.3K | 40.5% |
| Collectibles | 3,630 | 22,091 | $3.5K | 31.2% |
| Automotive & Motorcycle | 7,234 | 42,357 | $1.7K | 39.2% |
| Tools & Hardware | 4,995 | 25,702 | $2.5K | 27.8% |
| Toys & Hobbies | 8,048 | 42,780 | $1.5K | 29.2% |
Note. Shops, active products and revenue per shop are for the latest week. The top-10 share is of revenue among the category’s top-selling products we track; HHI is in the statistics.
7. Discussion
Read together, the evidence supports three audit questions. First, how much of reported revenue came with paid promotion, and is it above the market lower bound of 66.4%? Second, is ROAS reported as attributed revenue per dollar, and does the agency say how it relates to incremental sales? Third, how concentrated is revenue in a few products and creatives? Prior work on advertising measurement explains why the second question needs experiments [1].
The following checklist and test plan are a recommendation, not a finding. (1) Ask for account data, not summaries: spend, attributed revenue and orders by campaign and creative; organic and paid revenue by product and week; returns, refunds, affiliate commissions, creator fees and margins. (2) Ask for a revenue concentration table: the top ten products' and top ten creatives' shares of revenue, to compare with the category figures above. (3) Ask how many creatives were launched, and how many still sold after 28 days. Our data show a median age of 28 days for paid-led videos but cannot show whether an account's creative is repeatable. (4) Ask what the agency's definition of ROAS is, and the attribution window used. (5) Propose a holdout: pause or reduce paid promotion on a randomly chosen set of comparable products or time blocks, keep the rest running, and compare total shop revenue (not only attributed) after agreeing the success rule in advance. (6) Compare results with the right benchmark, the category median ROAS (for example 2.91 in Beauty & Personal Care and 1.94 in Jewelry Accessories & Derivatives), not just the market median of 2.37.
Alternative explanations apply. Paid promotion may be applied to videos that were already selling, which would inflate its apparent share. Top-coding at 80% means true paid shares are higher. Organic videos' higher engagement may reflect different audiences, not better content. And we cannot see margins, so a ROAS of 2.37 may be profitable for one brand and not another.
8. What this means for brands and founders
- Plan for paid reach: across the market at least 66.4% of top-video revenue came with paid promotion, so ask an agency what share of your revenue is paid and how that compares.
- Benchmark ROAS by category: the median estimated ROAS was 2.37 overall but 1.94 in Jewelry Accessories & Derivatives and 2.91 in Beauty & Personal Care, so judge reported ROAS against your own category and your margins.
- Ask for incrementality, not only attribution: 27.7% of paid video snapshots had a ROAS under 2, and attributed ROAS does not show sales that would have happened anyway, so agree a holdout test before scaling spend.
- Check concentration: the ten biggest products took 20.1% of top-product revenue in Fashion Accessories and 45.3% in Baby & Maternity, so calculate how much of your own revenue rests on your top ten products and creatives.
- Do not assume paid reach lifts sales per view: revenue per 1,000 views was $17.06 for organic and $16.02 for paid-led videos, so check revenue per view as well as total revenue.
9. Conclusion
In US TikTok Shop top-selling videos, paid promotion accounted for at least 66.4% of revenue on 16.1% of views, the median estimated ROAS was 2.37, and the ten biggest products held between 20.1% and 45.3% of top-product revenue by category. Paid-led and organic videos earned similar revenue per 1,000 views, so reported revenue alone does not show what paid spend added.
An agency audit is most useful when it separates attributed from incremental revenue, benchmarks ROAS against the right category, and reports concentration by product and creative. The test plan above is a recommendation that needs the brand's own account data to run.
Methodology
Weekly figures for the top-selling TikTok Shop videos in the US were collected from commercial data providers: each video’s estimated revenue, views and engagement in each week it ranked, the share of its revenue and views that came from paid promotion (reported per video and top-coded at 80%), its estimated return on ad spend and its publish date. One row is one video on one observation date (a video snapshot). Weekly category figures for the US (estimated revenue, its split between video, LIVE and the shop tab, affiliate revenue, shops and active products, and a year of weekly revenue) and daily rankings of each category’s top-selling products (unit price, commission rate, launch date and revenue by channel) were collected from several independent sources. Medians of price and commission are weighted by revenue; momentum compares the latest weeks with the same number of weeks before. This paper covers 2026-09-19 to 2026-10-18: 51,843 videos tracked.
Daily seven-day video snapshots can overlap and repeat the same video. Counts are observations, not independent weeks. Aggregate shares and medians are snapshot-weighted; summed revenue is not unique sales over the publication window.
Limitations
Product figures cover the top-selling products we track in each category, not every listing, so they describe what sells best rather than everything on sale. Video figures cover top-selling videos only. Paid shares are reported per video and top-coded at 80%, so they are lower bounds; ad spend and margins are not observed, so a reported return on ad spend says nothing about profit. Results are associations, not causes. Paid promotion, creator audience size and product price are not fully controlled for. Revenue, views and sales are estimates, not figures reported by TikTok. This is observational evidence from top-selling US TikTok Shop videos over one 30-day window, so it shows association, not cause, and says nothing about videos that did not sell. Paid shares are top-coded at 80% and are lower bounds. ROAS is estimated and attributed, with no margin, return or incrementality data. video snapshots from the same video are not independent, and some categories have few observations. Concentration figures describe tracked top-selling products, not an individual account. No videos were analysed in depth, so repeatable creative is not measured directly. The checklist and test plan are recommendations, not measured results. Daily seven-day video snapshots can overlap and repeat the same video. Counts are observations, not independent weeks. Aggregate shares and medians are snapshot-weighted; summed revenue is not unique sales over the publication window.
References
- [1]Lewis, R. A., & Rao, J. M. (2015). The unfavorable economics of measuring the returns to advertising. The Quarterly Journal of Economics, 130(4), 1941–1973. academic.oup.com/qje/article-abstract/130/4/1941/1914592
- [2]Szabo, G., & Huberman, B. A. (2010). Predicting the popularity of online content. Communications of the ACM, 53(8), 80–88. cacm.acm.org/research/predicting-the-popularity-of-online-content
- [3]Rhoades, S. A. (1993). The Herfindahl–Hirschman index. Federal Reserve Bulletin, 79, 188–189.
Cite as
MediaLabs Research, in collaboration with Coherence Limited (2026). TikTok Shop agency audit: questions to ask about results. ContentIQ Working Paper CIQ-WP-2026-58, version 1. https://medialabs-co.com/research/tiktok-shop-agency-audit
Analysis and data: Coherence Research, Coherence ContentIQ. Published by MediaLabs in collaboration with Coherence Limited.
Version history
- Version 118 Oct 2026This version