ContentIQ working paperCIQ-WP-2026-54TikTok ShopVersion 118 Oct 2026
TikTok Shop agency reporting: metrics that matter
51,843 videos tracked, 29 categories, 19 Sept–18 Oct 2026
MediaLabs Research · in collaboration with Coherence Limited
Key findings
- 0166.4% of revenueShare of top-video revenue and views that came with paid promotion (lower bounds, top-coded at 80%)
- 022.37 (1.95–2.81)Median estimated return on ad spend of paid video snapshots, with the middle half
- 0327.7%Share of paid video snapshots with an estimated return on ad spend under 2
- 041.94 to 2.91Range of category median return on ad spend, from Jewelry Accessories & Derivatives to Beauty & Personal Care
- 05$17.06 vs $16.02Revenue per 1,000 views of organic versus paid-led top-selling videos, on 11.9% versus 65.9% of revenue
Contents
Abstract
In our analysis of US TikTok Shop top-selling videos, paid promotion was associated with at least 66.4% of revenue on 16.1% of views, so a report that blends reach, sales and ad spend hides most of what matters. Estimated return on ad spend had a median of 2.37 (middle half 1.95 to 2.81), and 27.7% of paid video snapshots fell under 2. Median return varied by category from 1.94 to 2.91. We propose a monthly report with four separate layers (reach, attributed sales, paid reach and contribution margin) and a test plan. Contribution margin cannot be calculated from our data because product, fulfilment, commission and ad costs are not observed.
1. Introduction
Short answer: brands should ask an agency for a monthly report that keeps four things apart (reach, attributed sales, paid reach and contribution margin) and should treat any report that merges them, or states profit without cost data, as incomplete. Views, sales and ad spend each answer a different question, and a single blended figure cannot show which one moved.
The question matters because most top-video revenue on TikTok Shop in our analysis came with paid promotion, while paid views were a small share of all views. A report that shows only total views or total sales would not reveal how much of the result was bought. Returns to advertising are also hard to measure from observational data [1], so any attributed figure should be read as an estimate, not a proven effect.
Prior work shows that online attention is long-tailed and that early popularity predicts later popularity [2]. Affiliate commissions are set by negotiation and vary [3], which is one reason they belong as their own cost line when margin is calculated. This paper describes what paid and organic top-selling videos look like in the US TikTok Shop market and proposes a reporting structure. It uses correlation language throughout and does not claim that paid promotion causes sales.
2. Data
The window runs from 19 September to 18 October 2026. We tracked 51,843 videos across 29 categories on US TikTok Shop. The paid-share and return figures rest on 110,867 video snapshots from 33,825 top-selling videos, with one row per video and observation date. This paper does not use in-depth creative analysis.
For each video snapshot we recorded revenue, views, the share of revenue that came from paid promotion, estimated return on ad spend where paid promotion was present, likes and shares per 1,000 views, and video age. We did not observe product costs, fulfilment, returns, affiliate commissions or the full ad bill, so profit and contribution margin are outside the data.
Weekly figures for the top-selling TikTok Shop videos in the US were collected from commercial data providers: each video’s estimated revenue, views and engagement in each week it ranked, the share of its revenue and views that came from paid promotion (reported per video and top-coded at 80%), its estimated return on ad spend and its publish date. One row is one video on one observation date (a video snapshot). This paper covers 2026-09-19 to 2026-10-18: 51,843 videos tracked.
Daily seven-day video snapshots can overlap and repeat the same video. Counts are observations, not independent weeks. Aggregate shares and medians are snapshot-weighted; summed revenue is not unique sales over the publication window.
3. Methods
Paid share is recorded per video snapshot and top-coded at 80%. Market and category shares weight videos by their revenue (or views), so they are lower bounds. Return on ad spend is estimated revenue per dollar of ad spend, summarised by its median and middle half. For this analysis, videos with under 10% of revenue paid are classified as mostly organic.
Video economics use the distribution of top-selling videos' weekly revenue, revenue and engagement per 1,000 views (totals divided by total views), and each category's figures from its weekly records [2]. We grouped video snapshots into four paid bands: organic (under 10% paid), mixed (10–50%), mostly paid (50–80%) and paid-led (80% or more).
The analysis is descriptive. We did not run experiments, so none of the comparisons separates the effect of paid promotion from the kind of video that receives it.
4. Results: most revenue sits in paid-led videos
Across the market, paid promotion accounted for at least 66.4% of top-video revenue but 16.1% of views. Paid-led videos (80% or more paid) were 56.8% of video snapshots and 65.9% of revenue. Organic videos were 21% of video snapshots and 11.9% of revenue.
Revenue per 1,000 views was similar across bands: $17.06 for organic, $16.12 for mixed, $16.94 for mostly paid and $16.02 for paid-led. Median weekly revenue per video rose with paid share, from $1,550 for organic to $3,685 for paid-led. Engagement ran the other way: organic videos had 148.8 likes and 16.5 shares per 1,000 views, against 37.3 likes and 4.7 shares for paid-led videos.
Bands differ in video age as well. The median age was 30 days for organic videos, 13 days for mostly paid and 28 days for paid-led, so the bands are not like-for-like cohorts.
| Paid share of the video’s revenue | video snapshots (n) | Share of revenue | Revenue per 1,000 views | Median weekly revenue | Likes per 1,000 views | Median ROAS |
|---|---|---|---|---|---|---|
| Organic (under 10% paid) | 23,310 | 11.9% | $17.06 | $1.6K | 148.8 | — |
| Mixed (10–50% paid) | 6,933 | 5% | $16.12 | $2.5K | 96.2 | 2.34× |
| Mostly paid (50–80%) | 17,688 | 17.2% | $16.94 | $3.3K | 43.8 | 2.43× |
| Paid-led (80% or more) | 62,936 | 65.9% | $16.02 | $3.7K | 37.3 | 2.36× |
Note. A video snapshot is one video’s rolling seven-day metrics on an observation date. The paid share is reported per video and top-coded at 80%, so paid shares are lower bounds. ROAS is estimated revenue per dollar of ad spend.
5. Results: return on ad spend varies by category
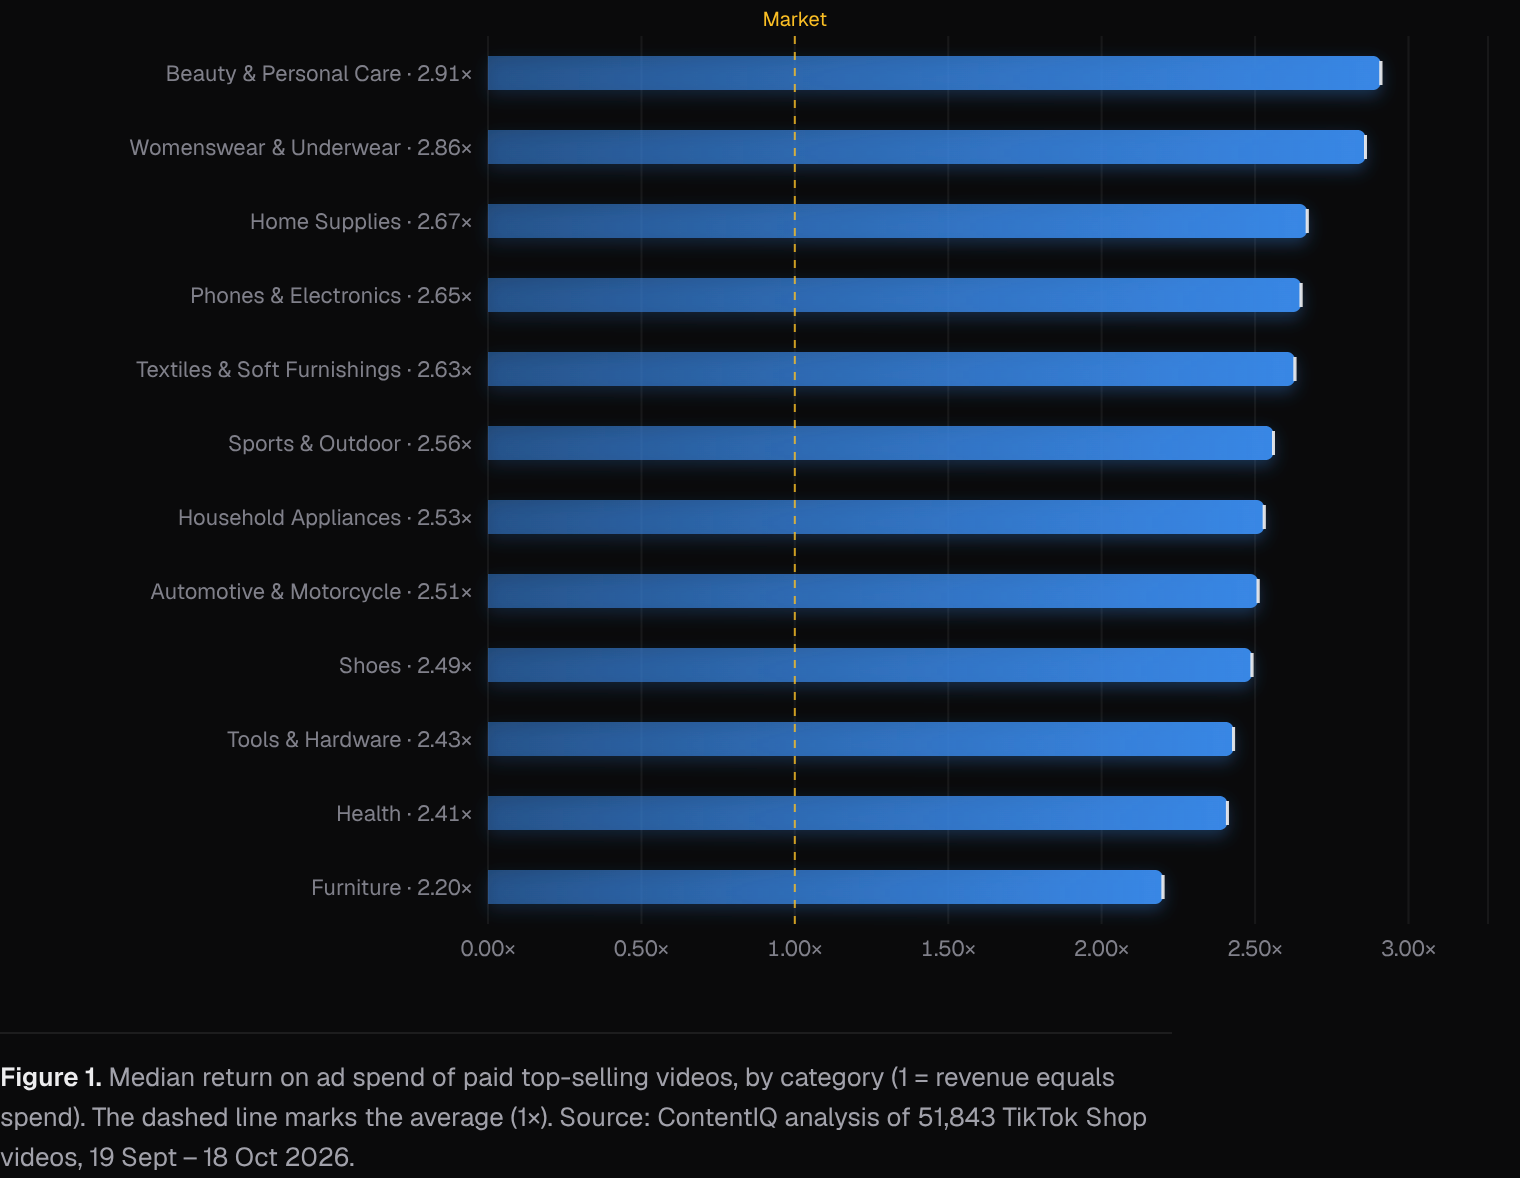
Estimated return on ad spend had a median of 2.37 across paid video snapshots, with a middle half of 1.95 to 2.81. In 27.7% of paid video snapshots it was under 2. A return of 1 means revenue equals ad spend, and whether a given return is profitable depends on margins we do not observe.
Category medians ranged from 1.94 (middle half 1.60 to 2.32) in Jewelry Accessories & Derivatives to 2.91 (2.39 to 3.28) in Beauty & Personal Care. Womenswear & Underwear was at 2.86 and Menswear & Underwear at 2.75. At the low end, Baby & Maternity was at 1.96 and Kids' Fashion at 2.02. The middle halves of many categories overlap, so small gaps between neighbouring categories should not be over-read.
6. Results: paid share and views differ by category
The paid share of revenue ran from 51.6% in Kids' Fashion to 72.4% in Household Appliances, and most categories sat in the 60s. Paid views were 33.5% in Health and 31.7% in Shoes, against 9.2% in Books, Magazines & Audio and 9.3% in Textiles & Soft Furnishings. Because paid revenue shares are lower bounds, the gaps between categories are indicative.
Organic video snapshots were most common in Kids' Fashion (31.6%) and Food & Beverages (30%), and least common in Beauty & Personal Care (10.7%). Revenue per 1,000 views for organic and paid-led videos moved in different directions by category. Household Appliances had $38.91 organic against $28.98 paid-led, and Furniture $33.34 against $23.27. Baby & Maternity was the reverse at $12.73 against $22.87. These are descriptive splits, not tests of paid effectiveness.
| Category | video snapshots (n) | Paid share of revenue | Paid share of views | Mostly organic video snapshots | Median ROAS (middle half) |
|---|---|---|---|---|---|
| Beauty & Personal Care | 4,839 | 70.4% | 15.1% | 10.7% | 2.91× (2.4–3.3) |
| Womenswear & Underwear | 3,103 | 67.3% | 15.5% | 14.1% | 2.86× (2.5–3.1) |
| Household Appliances | 3,279 | 72.4% | 21.3% | 11.2% | 2.53× (2.1–3.0) |
| Phones & Electronics | 4,881 | 64.4% | 16.6% | 18.4% | 2.65× (2.1–3.0) |
| Sports & Outdoor | 4,676 | 66.1% | 21.4% | 20.1% | 2.56× (2.1–3.0) |
| Health | 3,789 | 70.3% | 33.5% | 14.3% | 2.41× (2.1–2.9) |
| Shoes | 3,443 | 67.5% | 31.7% | 15.7% | 2.49× (2.2–2.8) |
| Furniture | 4,048 | 66.1% | 20.5% | 16.4% | 2.20× (1.9–2.6) |
| Home Supplies | 3,755 | 66.6% | 13.8% | 15% | 2.67× (2.3–3.0) |
| Tools & Hardware | 4,585 | 67.9% | 10.6% | 14.9% | 2.43× (2.0–2.8) |
| Textiles & Soft Furnishings | 3,407 | 68.7% | 9.3% | 11.6% | 2.63× (2.3–2.9) |
| Automotive & Motorcycle | 5,017 | 67.8% | 13.6% | 17.9% | 2.51× (2.1–2.9) |
| Menswear & Underwear | 3,353 | 61.9% | 13.2% | 20.6% | 2.75× (2.4–3.1) |
| Fashion Accessories | 4,594 | 58.8% | 17.3% | 26.9% | 2.24× (1.9–2.7) |
| Home Improvement | 4,846 | 67.1% | 14% | 17.5% | 2.30× (1.9–2.7) |
Note. Mostly organic: under 10% of the video’s revenue paid. Paid shares are top-coded at 80% per video, so they are lower bounds.
7. Discussion
For brands and creators, the main implication is that a monthly report should show four layers separately. Reach covers organic and paid views. Attributed sales are revenue linked to the video or creator. Paid reach covers spend, paid views and estimated return. Contribution margin is attributed sales less product, fulfilment, commission, returns and ad costs. In our data, paid-led videos earned most of the revenue on a minority of views, which is why paid and organic reach need separate lines. Margin is the one layer we cannot compute. Until cost inputs are supplied, any statement of profit would be unsupported.
Recommendation, not a finding. Checklist: (1) show organic and paid views and revenue as separate lines for every video; (2) report estimated return on ad spend as a median with a range, not a single average; (3) mark which figures are estimates and how attribution was assigned; (4) add cost lines for product, fulfilment, returns, commission and ad spend, and calculate contribution margin only once all are present; (5) state the break-even return implied by your own margin, and track the share of paid weeks below it; (6) benchmark against your category's median and middle half, not the market median.
Recommendation, not a finding. Test plan: choose a set of comparable videos or products, hold paid promotion back on a randomly chosen subset for a pre-agreed period, and compare attributed sales and margin against the rest. Define the metric, period and decision rule before starting. Randomised holdouts are the safer way to measure the returns to advertising [1], and our observational figures cannot replace one.
Alternative explanations are plausible. Brands may put spend behind videos that are already selling, which would raise paid share among top sellers without paid promotion causing the sales. Top-coding at 80% understates paid share. Estimated return depends on how revenue is attributed to spend. The window is one month, and top-selling videos are a selected group, so results do not describe all UGC or all TikTok Shop sellers.
8. What this means for brands and founders
- Plan for paid reach: in these top-selling videos at least 66.4% of revenue came with paid promotion on 16.1% of views, so ask your agency to report paid and organic views and sales on separate lines.
- Set your own return floor: the median estimated return on ad spend was 2.37 (middle half 1.95 to 2.81) and 27.7% of paid video snapshots were under 2, so work out the break-even return from your margin and track how many weeks fall below it.
- Benchmark within your category: median return was 2.91 (2.39 to 3.28) in Beauty & Personal Care and 1.94 (1.60 to 2.32) in Jewelry Accessories & Derivatives, so a market-wide average can mislead.
- Do not write off organic: organic videos earned $17.06 per 1,000 views against $16.02 for paid-led, while taking 11.9% of revenue, so keep them as their own reporting line.
- Add costs before claiming profit: a return of 2.37 means revenue per ad dollar, not margin, so contribution margin needs product, fulfilment, commission, returns and ad costs.
9. Conclusion
In US TikTok Shop top-selling videos, paid promotion was associated with at least 66.4% of revenue on 16.1% of views, with a median estimated return on ad spend of 2.37 and a category range of 1.94 to 2.91. These patterns support reporting reach, attributed sales, paid reach and contribution margin as separate layers.
Margin cannot be derived from our data, so profit questions need the brand's own cost inputs. The checklist and holdout test above are recommendations to be tested, not measured results, and they should be adapted to each brand's categories, costs and attribution rules.
Methodology
Weekly figures for the top-selling TikTok Shop videos in the US were collected from commercial data providers: each video’s estimated revenue, views and engagement in each week it ranked, the share of its revenue and views that came from paid promotion (reported per video and top-coded at 80%), its estimated return on ad spend and its publish date. One row is one video on one observation date (a video snapshot). This paper covers 2026-09-19 to 2026-10-18: 51,843 videos tracked.
Daily seven-day video snapshots can overlap and repeat the same video. Counts are observations, not independent weeks. Aggregate shares and medians are snapshot-weighted; summed revenue is not unique sales over the publication window.
Limitations
Video figures cover top-selling videos only. Paid shares are reported per video and top-coded at 80%, so they are lower bounds; ad spend and margins are not observed, so a reported return on ad spend says nothing about profit. Results are associations, not causes. Paid promotion, creator audience size and product price are not fully controlled for. Revenue, views and sales are estimates, not figures reported by TikTok. Paid shares are reported per video and top-coded at 80%, so market and category paid shares are lower bounds. Return on ad spend is estimated, and whether a return is profitable depends on margins we do not observe, so contribution margin and profit cannot be calculated. The data covers top-selling videos on US TikTok Shop over one month, which is a selected group, and it is observational, so it shows associations only. Paid bands differ in video age, and no in-depth video analysis is included. Daily seven-day video snapshots can overlap and repeat the same video. Counts are observations, not independent weeks. Aggregate shares and medians are snapshot-weighted; summed revenue is not unique sales over the publication window.
References
- [1]Lewis, R. A., & Rao, J. M. (2015). The unfavorable economics of measuring the returns to advertising. The Quarterly Journal of Economics, 130(4), 1941–1973. academic.oup.com/qje/article-abstract/130/4/1941/1914592
- [2]Szabo, G., & Huberman, B. A. (2010). Predicting the popularity of online content. Communications of the ACM, 53(8), 80–88. cacm.acm.org/research/predicting-the-popularity-of-online-content
- [3]Libai, B., Biyalogorsky, E., & Gerstner, E. (2003). Setting referral fees in affiliate marketing. Journal of Service Research, 5(4), 303–315. doi.org/10.1177/1094670503005004003
Cite as
MediaLabs Research, in collaboration with Coherence Limited (2026). TikTok Shop agency reporting: metrics that matter. ContentIQ Working Paper CIQ-WP-2026-54, version 1. https://medialabs-co.com/research/tiktok-shop-agency-reporting
Analysis and data: Coherence Research, Coherence ContentIQ. Published by MediaLabs in collaboration with Coherence Limited.
Version history
- Version 118 Oct 2026This version