ContentIQ working paperCIQ-WP-2026-57TikTok ShopVersion 118 Oct 2026
TikTok Shop agency vs in-house: how to compare the options
51,843 videos tracked, 29 categories, 19 September–18 October 2026
MediaLabs Research · in collaboration with Coherence Limited
Key findings
- 017.4%–85.3%range of category revenue credited to affiliate creators across categories, latest week
- 025.3%–78.7%range of category revenue sold through shoppable video, from Collectibles to Baby & Maternity
- 0342.6%share of top-video revenue taken by the top 10% of video snapshots (top 1%: 11.1%)
- 04$2,950median weekly revenue of a top-selling video (25th to 75th percentile: $1,199 to $6,799)
- 05$9.78–$29.14range of revenue per 1,000 views by category (market: $16.3)
Contents
Abstract
Brands deciding between an agency and an in-house team for TikTok Shop need a way to compare the options, but our data cannot say which performs better: it measures neither agency fees nor agency-versus-in-house results. What it does show is where US TikTok Shop revenue is made, which sets the capabilities any team needs. In the latest week, shoppable video carried between 5.3% and 78.7% of category revenue, and affiliate creators were credited with between 7.4% and 85.3%. In top-selling videos, the top 10% of video snapshots took 42.6% of revenue. We turn these observations into a decision matrix and a test plan, labelled as recommendations, not findings.
1. Introduction
Short answer: this paper cannot tell you whether an agency or an in-house team will perform better, and no figure here should be read that way. The decision is better framed as which capabilities you need to own, how much creative output you need, and how many sales channels you need to coordinate, and then tested against your own results. Our data describe how US TikTok Shop revenue is distributed, which indicates what those capabilities have to cover. They do not include agency fees, service terms or any comparison of agency-run and brand-run accounts.
The question matters because the evidence suggests that how a category sells differs sharply. Where most revenue arrives through shoppable video and affiliate creators, creative volume and creator coordination are central. Where the shop tab or LIVE dominates, the work looks different. Prior work shows that online attention is long-tailed and that early popularity predicts later popularity [1], which suggests that a few videos can matter far more than the average one. Live-stream selling has been linked to trust and engagement in social commerce [2], and affiliate commission levels are set deliberately by sellers and vary [3]. Returns to advertising are also hard to measure from observational data [4], a caution that applies to any agency comparison made from outcomes alone. These are US TikTok Shop observations, not a view of all user-generated content everywhere.
2. Data
The window runs from 19 September to 18 October 2026. Across it we tracked 51,843 videos in 29 categories. This paper does not use in-depth creative analysis, so this paper says nothing about creative content, hooks, formats or who made a video.
The video economics rest on 114,064 video snapshots from 35,199 top-selling videos, where a video snapshot is one video observed on a date with rolling seven-day metrics. The sales-channel split is for the latest week, as of 12 October 2026. For each category we recorded revenue through shoppable video, LIVE and the shop tab, and the share of revenue credited to affiliate creators. For each video snapshot we recorded weekly revenue, views, likes, comments and shares. Units sold and average order value are available for only 364 video snapshots. Category tables hold roughly 3,256 to 5,177 video snapshots each.
Weekly figures for the top-selling TikTok Shop videos in the US were collected from commercial data providers: each video’s estimated revenue, views and engagement in each week it ranked, the share of its revenue and views that came from paid promotion (reported per video and top-coded at 80%), its estimated return on ad spend and its publish date. One row is one video on one observation date (a video snapshot). Weekly category figures for the US (estimated revenue, its split between video, LIVE and the shop tab, affiliate revenue, shops and active products, and a year of weekly revenue) and daily rankings of each category’s top-selling products (unit price, commission rate, launch date and revenue by channel) were collected from several independent sources. Medians of price and commission are weighted by revenue; momentum compares the latest weeks with the same number of weeks before. This paper covers 2026-09-19 to 2026-10-18: 51,843 videos tracked.
Daily seven-day video snapshots can overlap and repeat the same video. Counts are observations, not independent weeks. Aggregate shares and medians are snapshot-weighted; summed revenue is not unique sales over the publication window.
3. Methods
Sales channels: each category's revenue in the latest week was split into shoppable video, LIVE and the shop tab. The remainder would be other or unattributed, and it was 0% in every category shown. The affiliate share is the portion of category revenue credited to affiliate creators.
Video economics: we took the distribution of top-selling videos' weekly revenue, with one row per video and observation date, and report percentiles. We also computed the share of total revenue taken by the top 10% and top 1% of video snapshots. Revenue and engagement per 1,000 views are totals divided by total views, not averages of per-video ratios. Each category's share of revenue through video comes from its weekly figures, and the long-tailed framing follows [1].
No confidence ranges were computed for these descriptive statistics, and no model was fitted. Nothing here estimates the effect of any operating model.
4. Results: where category revenue is made
Channel mix differs widely by category. Shoppable video carried 78.7% of revenue in Baby & Maternity, 71.9% in Womenswear & Underwear and 71.2% in Shoes, but only 5.3% in Collectibles. The shop tab carried 56% of Collectibles revenue, 54.5% in Jewelry Accessories & Derivatives and 53% in Books, Magazines & Audio.
LIVE ranged from 4.9% of revenue in Menswear & Underwear to 38.7% in Collectibles. Health had 23.8% and Home Improvement 20%. Beauty & Personal Care split 68.3% video, 16.6% LIVE and 15.1% shop tab.
Affiliate creators were credited with between 7.4% (Collectibles) and 85.3% (Baby & Maternity) of category revenue. Categories with a high video share also tend to have a high affiliate share, for example Beauty & Personal Care at 80.2% and Household Appliances at 82.4%. This is an association within one week and does not show why.
| Category | Video | LIVE | Shop tab | Other | Through affiliates |
|---|---|---|---|---|---|
| Beauty & Personal Care | 68.3% | 16.6% | 15.1% | 0% | 80.2% |
| Womenswear & Underwear | 71.9% | 11.5% | 16.6% | 0% | 79.6% |
| Sports & Outdoor | 63.7% | 13.5% | 22.8% | 0% | 75.2% |
| Fashion Accessories | 55.6% | 10.9% | 33.5% | 0% | 60.5% |
| Phones & Electronics | 62.7% | 19% | 18.3% | 0% | 75.7% |
| Health | 64% | 23.8% | 12.3% | 0% | 81.7% |
| Home Supplies | 59.2% | 15.4% | 25.4% | 0% | 71.3% |
| Menswear & Underwear | 67.6% | 4.9% | 27.5% | 0% | 69.6% |
| Shoes | 71.2% | 12.2% | 16.5% | 0% | 80.2% |
| Furniture | 56.2% | 14.4% | 29.4% | 0% | 71.3% |
| Household Appliances | 64.9% | 18.6% | 16.5% | 0% | 82.4% |
| Collectibles | 5.3% | 38.7% | 56% | 0% | 7.4% |
| Automotive & Motorcycle | 66.7% | 8.1% | 25.2% | 0% | 70.9% |
| Tools & Hardware | 60.4% | 10.9% | 28.7% | 0% | 70.2% |
| Toys & Hobbies | 62.5% | 16% | 21.5% | 0% | 74.6% |
Note. Shares of each category’s estimated revenue in the latest week. Through affiliates is revenue credited to creators other than the selling shop.
5. Results: how unevenly top videos earn
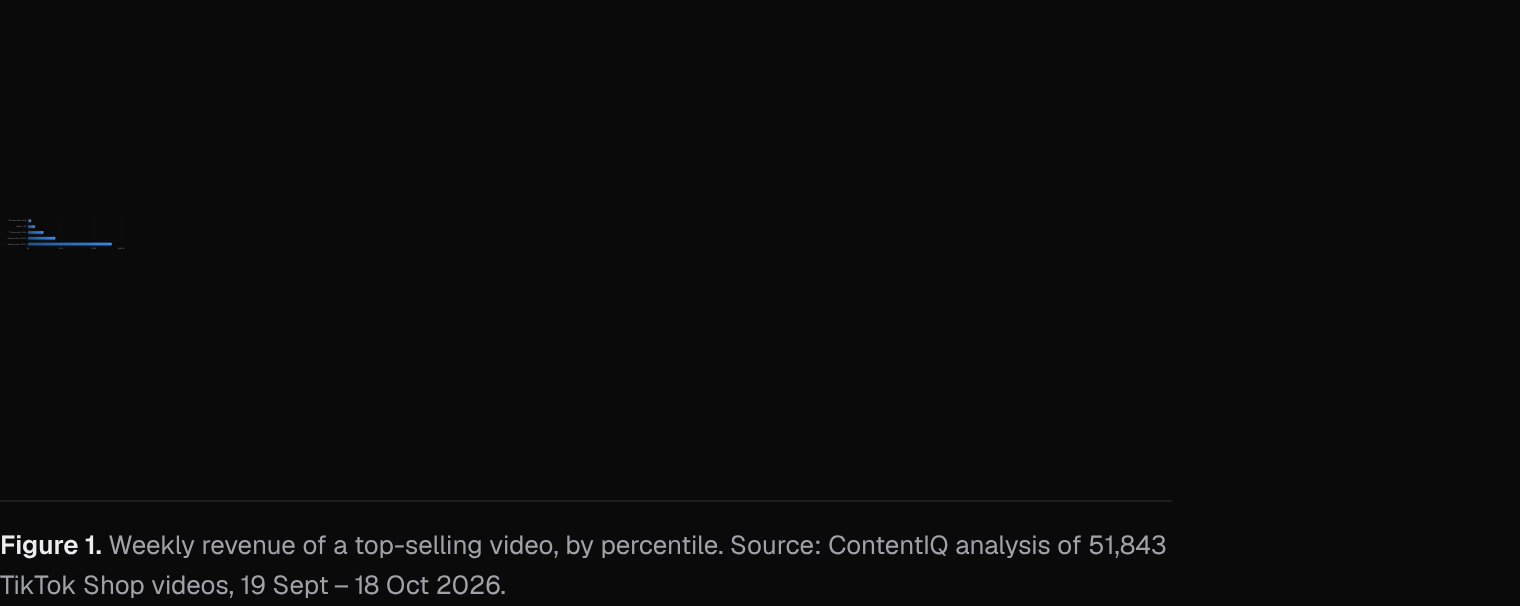
Among top-selling videos, the median video snapshot earned $2,950. The 25th percentile was $1,199, the 75th $6,799, the 90th $12,240 and the 99th $37,920. Even within this selected group, earnings are widely spread.
Revenue is also concentrated. The top 10% of video snapshots took 42.6% of revenue and the top 1% took 11.1%. By category, the top-10% share ranged from 27.2% in Menswear & Underwear to 45.4% in Household Appliances.
This long-tailed pattern is consistent with earlier work on online attention [1]. For a brand it means that output volume and hit rate are different things, and that averages across videos can mislead. These are top-selling videos only, so the figures say nothing about videos that did not sell.
6. Results: revenue per 1,000 views by category
Across the market, top-selling videos brought in $16.3 per 1,000 views, with 54 likes, 0.5 comments and 6.5 shares per 1,000 views. By category, revenue per 1,000 views ranged from $9.78 in Books, Magazines & Audio to $29.14 in Household Appliances. Furniture ($24.29), Shoes ($23.38) and Health ($21.78) were also above the market figure.
Median weekly revenue per top video also varied: $11,130 in Beauty & Personal Care and $10,464 in Womenswear & Underwear, against $860 in Jewelry Accessories & Derivatives. A high median does not imply a high yield per view, so revenue per view and absolute revenue need to be read together.
Units data are thin. The 0.22 units per 1,000 views and the $87.64 average order value rest on only 364 video snapshots and should be treated with caution.
| Category | video snapshots (n) | Median weekly revenue | Revenue per 1,000 views | Top 10% of video snapshots’ share | Category revenue through video |
|---|---|---|---|---|---|
| Beauty & Personal Care | 4,965 | $11.1K | $17.87 | 35.9% | 68.3% |
| Womenswear & Underwear | 3,256 | $10.5K | $18.28 | 27.9% | 71.9% |
| Household Appliances | 3,407 | $6.6K | $29.14 | 45.4% | 64.9% |
| Phones & Electronics | 5,001 | $4.8K | $12.55 | 35.7% | 62.7% |
| Sports & Outdoor | 4,813 | $5.5K | $17.37 | 31.8% | 63.7% |
| Health | 3,952 | $5.8K | $21.78 | 30.4% | 64% |
| Shoes | 3,593 | $6.3K | $23.38 | 30.7% | 71.2% |
| Furniture | 4,181 | $5K | $24.29 | 31.5% | 56.2% |
| Home Supplies | 3,897 | $4.6K | $12.58 | 33.9% | 59.2% |
| Tools & Hardware | 4,714 | $3.6K | $17.21 | 33.9% | 60.4% |
| Textiles & Soft Furnishings | 3,517 | $5.1K | $15.91 | 35.4% | 63.2% |
| Automotive & Motorcycle | 5,177 | $2.8K | $10.89 | 37.8% | 66.7% |
| Menswear & Underwear | 3,498 | $5.2K | $11.65 | 27.2% | 67.6% |
| Fashion Accessories | 4,746 | $3.4K | $17.75 | 29.1% | 55.6% |
| Home Improvement | 4,913 | $2.4K | $15.60 | 38.8% | 48.5% |
Note. A video snapshot is one video’s rolling seven-day metrics on an observation date. Category revenue through video is from the category’s own weekly figures.
7. Discussion
What the data support: the sources of revenue differ by category, and revenue per top video is uneven. What they do not support: any claim that agencies or in-house teams produce better sales, lower costs or higher yield. Our data have no flag for who runs an account and no fee information. Observational returns to advertising are hard to isolate [4], and categories differ in many ways, so differences in outcomes could come from product, price, audience, budget or timing. The affiliate share also does not show whether a brand works through creators directly or through an intermediary.
Recommendation, not a finding: a decision matrix. (1) Internal ownership: keep in-house the things that need product, margin and customer knowledge, such as offer and pricing, sample and stock decisions, and the brief; consider outsourcing only what you cannot staff. (2) Creative volume: where video and affiliate shares are high, as in Baby & Maternity (78.7% video, 85.3% affiliate), ask who can sustain the output and creator relationships you need. (3) Channel coordination: where the shop tab or LIVE is large, as in Collectibles (56% shop tab, 38.7% LIVE), ask who can coordinate LIVE schedules, shop listings and video so they do not work in isolation.
Recommendation, not a finding: a checklist and test plan. First, write down your category's channel mix from the results above and mark which of the three matrix rows matters most to you. Second, ask any agency candidate, in writing, for fee structure, contract length, who owns the creator relationships and content, what reporting you receive and how they treat affiliate commissions [3]. Third, if you test, agree the metrics in advance, such as revenue per 1,000 views by channel against the benchmarks here, and keep products and budgets comparable across the arms. Fourth, set a fixed review window and a decision rule before you start. Fifth, treat the result as one test in your own conditions, not proof about agencies in general.
8. What this means for brands and founders
- Match capabilities to your category: Baby & Maternity sold 78.7% of its revenue through shoppable video and 85.3% through affiliate creators, so in categories like this creative volume and creator coordination are worth weighing first when comparing agency and in-house options.
- Check channel coordination if you sell in shop-tab-heavy categories: Collectibles had 56% of revenue on the shop tab and 38.7% on LIVE, so ask any team how video, LIVE and listings will be run together.
- Benchmark before you test: the median top-selling video earned $2,950 a week and the market earned $16.3 per 1,000 views, so set your own targets against figures like these and agree them before comparing an agency with in-house work.
- Plan for uneven results: the top 10% of video snapshots took 42.6% of top-video revenue, so judge any team on several videos and weeks, not on single hits.
- Ask for fee and ownership terms in writing: our data contain no agency fees or service terms, so these cannot be benchmarked here and need to be gathered from each option you consider.
9. Conclusion
The agency versus in-house choice cannot be settled by this dataset, and we do not claim it can. Within US TikTok Shop, category revenue is made in very different places, with video shares from 5.3% to 78.7% and affiliate shares from 7.4% to 85.3%, and top-video revenue is concentrated, with the top 10% of video snapshots taking 42.6%. A sensible comparison starts from which capabilities your category demands, then uses written terms and a pre-agreed test to compare options. Fee levels and causal performance remain unmeasured here.
Methodology
Weekly figures for the top-selling TikTok Shop videos in the US were collected from commercial data providers: each video’s estimated revenue, views and engagement in each week it ranked, the share of its revenue and views that came from paid promotion (reported per video and top-coded at 80%), its estimated return on ad spend and its publish date. One row is one video on one observation date (a video snapshot). Weekly category figures for the US (estimated revenue, its split between video, LIVE and the shop tab, affiliate revenue, shops and active products, and a year of weekly revenue) and daily rankings of each category’s top-selling products (unit price, commission rate, launch date and revenue by channel) were collected from several independent sources. Medians of price and commission are weighted by revenue; momentum compares the latest weeks with the same number of weeks before. This paper covers 2026-09-19 to 2026-10-18: 51,843 videos tracked.
Daily seven-day video snapshots can overlap and repeat the same video. Counts are observations, not independent weeks. Aggregate shares and medians are snapshot-weighted; summed revenue is not unique sales over the publication window.
Limitations
Product figures cover the top-selling products we track in each category, not every listing, so they describe what sells best rather than everything on sale. Video figures cover top-selling videos only. Paid shares are reported per video and top-coded at 80%, so they are lower bounds; ad spend and margins are not observed, so a reported return on ad spend says nothing about profit. Results are associations, not causes. Paid promotion, creator audience size and product price are not fully controlled for. Revenue, views and sales are estimates, not figures reported by TikTok. The dataset does not measure agency fees, service scope, or who runs any account, and it cannot compare agency and in-house performance causally. Findings are US TikTok Shop observations from a single 30-day window, not all user-generated content everywhere. The channel split covers one latest week (as of 12 October 2026). The economics cover top-selling videos only, so they exclude videos that did not sell. No videos were analysed in depth, so creative content is not assessed. Units sold and average order value rest on only 364 video snapshots. No confidence ranges were computed for these descriptive figures. Category differences may reflect product, price and audience, not how a team is organised. Daily seven-day video snapshots can overlap and repeat the same video. Counts are observations, not independent weeks. Aggregate shares and medians are snapshot-weighted; summed revenue is not unique sales over the publication window.
References
- [1]Szabo, G., & Huberman, B. A. (2010). Predicting the popularity of online content. Communications of the ACM, 53(8), 80–88. cacm.acm.org/research/predicting-the-popularity-of-online-content
- [2]Wongkitrungrueng, A., & Assarut, N. (2020). The role of live streaming in building consumer trust and engagement with social commerce sellers. Journal of Business Research, 117, 543–556. www.sciencedirect.com/science/article/abs/pii/S0148296318304168
- [3]Libai, B., Biyalogorsky, E., & Gerstner, E. (2003). Setting referral fees in affiliate marketing. Journal of Service Research, 5(4), 303–315. doi.org/10.1177/1094670503005004003
- [4]Lewis, R. A., & Rao, J. M. (2015). The unfavorable economics of measuring the returns to advertising. The Quarterly Journal of Economics, 130(4), 1941–1973. academic.oup.com/qje/article-abstract/130/4/1941/1914592
Cite as
MediaLabs Research, in collaboration with Coherence Limited (2026). TikTok Shop agency vs in-house: how to compare the options. ContentIQ Working Paper CIQ-WP-2026-57, version 1. https://medialabs-co.com/research/tiktok-shop-agency-vs-in-house
Analysis and data: Coherence Research, Coherence ContentIQ. Published by MediaLabs in collaboration with Coherence Limited.
Version history
- Version 118 Oct 2026This version