ContentIQ working paperCIQ-WP-2026-71TikTok ShopVersion 118 Oct 2026
TikTok Shop Black Friday planning: category seasonality
29 categories covered, window 19 Sept–18 Oct 2026, revenue data as of 12 Oct 2026
MediaLabs Research · in collaboration with Coherence Limited
Key findings
- 011.23×Pre-Owned revenue against a normal month in last year's Black Friday / Cyber Monday months, the highest in our list
- 020.81×Toys & Hobbies in the same months, below a normal month
- 030.93 → 1.10All categories, November 2025 then December 2025, against a normal month (1 = normal)
- 04-4.2%Beauty & Personal Care, 19.2% of revenue, last 4 weeks against the previous 4
- 052 of 25categories in the momentum table grew in the last 4 weeks (Home Supplies +1.1%, Baby & Maternity +0.1%)
Contents
- Abstract
- 1.Introduction
- 2.Data
- 3.Methods
- 4.Results: categories against a normal month in last year's Black Friday months
- 5.Results: the market-wide monthly pattern
- 6.Results: current revenue share and momentum
- 7.Discussion
- 8.What this means for brands and founders
- 9.Conclusion
- Methodology
- Limitations
- References
- Cite as
Abstract
Plan Black Friday by category: treat last year's seasonal pattern as a starting hypothesis, not a forecast, and test small before the peak. In US TikTok Shop data, categories' revenue in last year's November and December ran from 0.81× a normal month (Toys & Hobbies) to 1.23× (Pre-Owned). Market-wide, November 2025 was 0.93× normal and December 2025 was 1.10×. In the latest 4 weeks, 23 of the 25 categories in our momentum table had revenue below the prior 4 weeks. This is a single-year pattern, so season cannot be separated from one-off events, and we give no campaign dates or platform rules.
1. Introduction
The decision: which categories to put behind a Black Friday push, and how much to test before committing budget. Our answer is to use last year's category seasonality as a prior and current momentum as a check on it, then run small, pre-defined tests ahead of the peak rather than betting the quarter on a single pattern. Last year's pattern is a record of what happened, not a forecast of what will happen.
This matters because retail moments reshape demand unevenly. In last year's Black Friday / Cyber Monday months, some categories sold well above a normal month and others well below. Telling these apart early lets brands and the creators they work with decide where to concentrate content and inventory.
Prior work gives us two cautions. Separating seasonal patterns from underlying trend is a standard time-series problem [1], and the returns to advertising are hard to measure from observational data [2]. We therefore describe patterns and keep any recommendation separate from the findings.
All figures are US TikTok Shop observations, not user-generated content everywhere.
2. Data
The window is 19 September to 18 October 2026, with revenue data as of 12 October 2026. Our analysis covers 29 categories. No videos were analysed in depth for this paper, so it rests on category revenue estimates and does not describe video content, creators or products.
For each category we hold estimated weekly revenue over the past year. From it we derive each category's share of all revenue tracked, recent momentum and calendar-month seasonality. The retail moments are the windows used in our analysis: Halloween (25 September–31 October 2026), Black Friday / Cyber Monday (10 November–2 December 2026), Holiday gifting (15 November–24 December 2026) and New Year resolutions (January 2027). They are calendar windows for analysis, not announced campaign dates or platform schedules.
Weekly category figures for the US (estimated revenue, its split between video, LIVE and the shop tab, affiliate revenue, shops and active products, and a year of weekly revenue) and daily rankings of each category’s top-selling products (unit price, commission rate, launch date and revenue by channel) were collected from several independent sources. Medians of price and commission are weighted by revenue; momentum compares the latest weeks with the same number of weeks before. This paper covers 2026-09-19 to 2026-10-18.
3. Methods
Momentum compares a category's estimated revenue in the latest 4 and 13 weeks with the same number of weeks before, using weekly revenue over the past year. Shares are of all categories tracked.
Seasonality compares each month's revenue with the category's average month over the past year, so 1 means a normal month. Partial first and last months are left out. STL [1] is background on separating season from trend; these simple monthly ratios do not implement a seasonal-trend decomposition. A retail moment's figure is the category's value for the calendar months it spans last year.
The evidence gives no confidence ranges for these indices or growth rates, so we report point values and treat small differences as indistinguishable.
4. Results: categories against a normal month in last year's Black Friday months
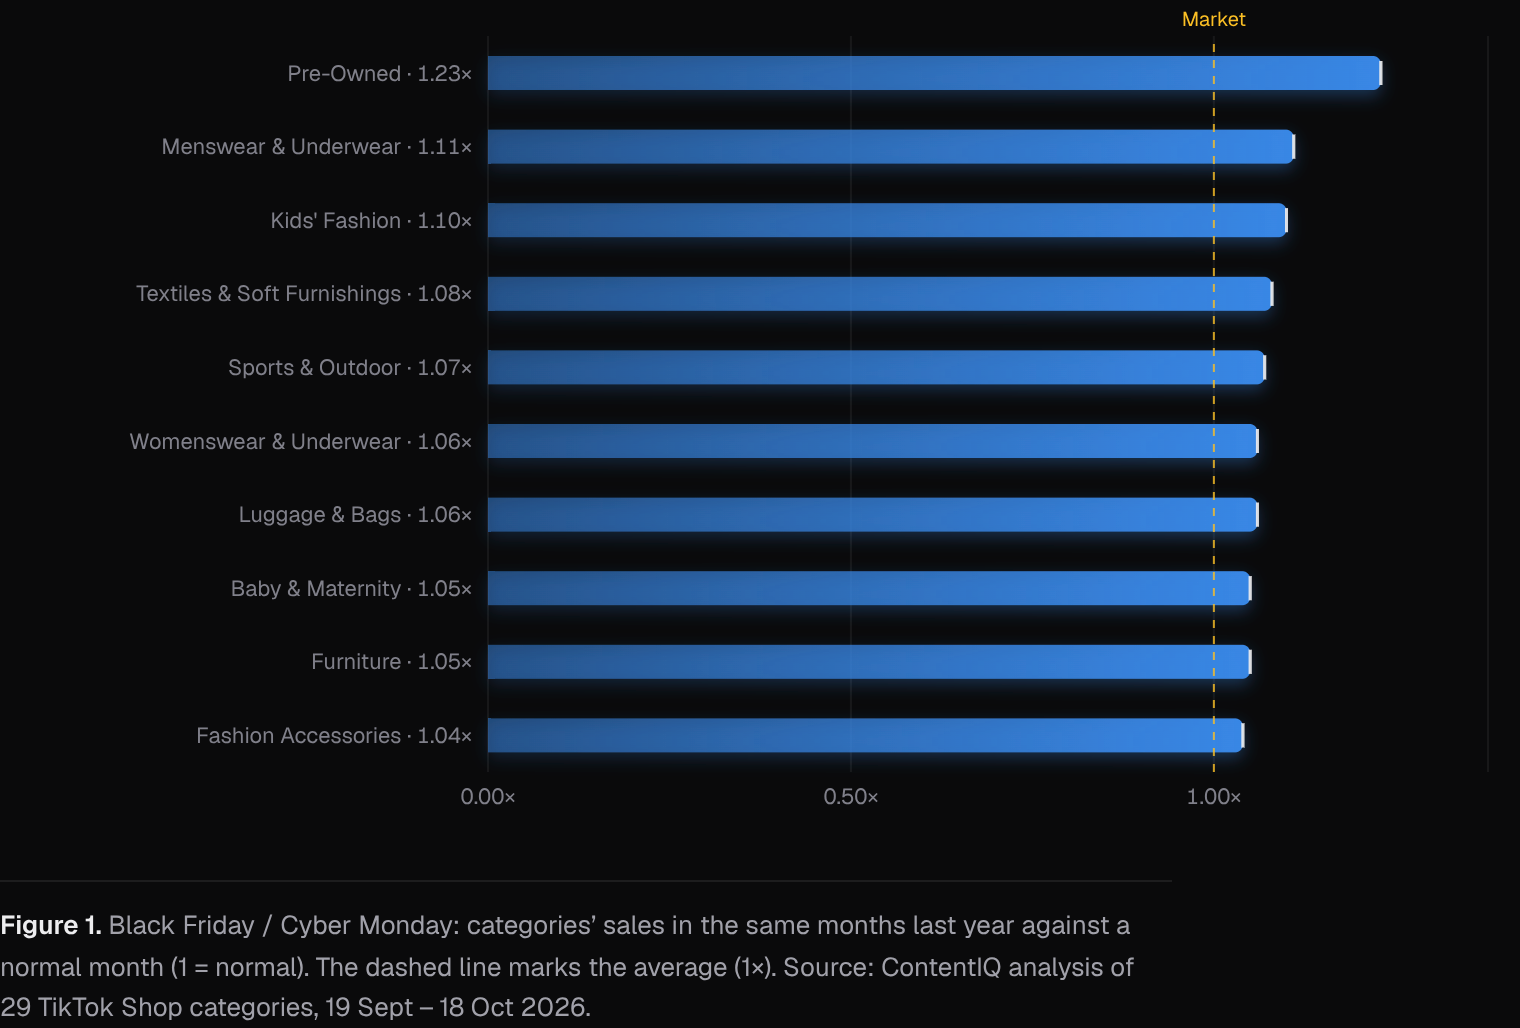
In the same months last year as the Black Friday / Cyber Monday window (November and December), Pre-Owned sold at 1.23× a normal month. Next were Menswear & Underwear (1.11×), Kids' Fashion (1.10×), Textiles & Soft Furnishings (1.08×) and Sports & Outdoor (1.07×). Womenswear & Underwear and Luggage & Bags were 1.06×, Baby & Maternity and Furniture 1.05×, and Fashion Accessories 1.04×.
Two categories sat below normal: Household Appliances (0.93×) and Toys & Hobbies (0.81×). Categories not shown in the evidence fall between these lists.
The Holiday gifting moment spans the same calendar months, so it shows identical values. With monthly data we cannot separate Black Friday from the wider holiday season, and the lift in these categories is associated with the whole period, not with the sale event alone.
5. Results: the market-wide monthly pattern
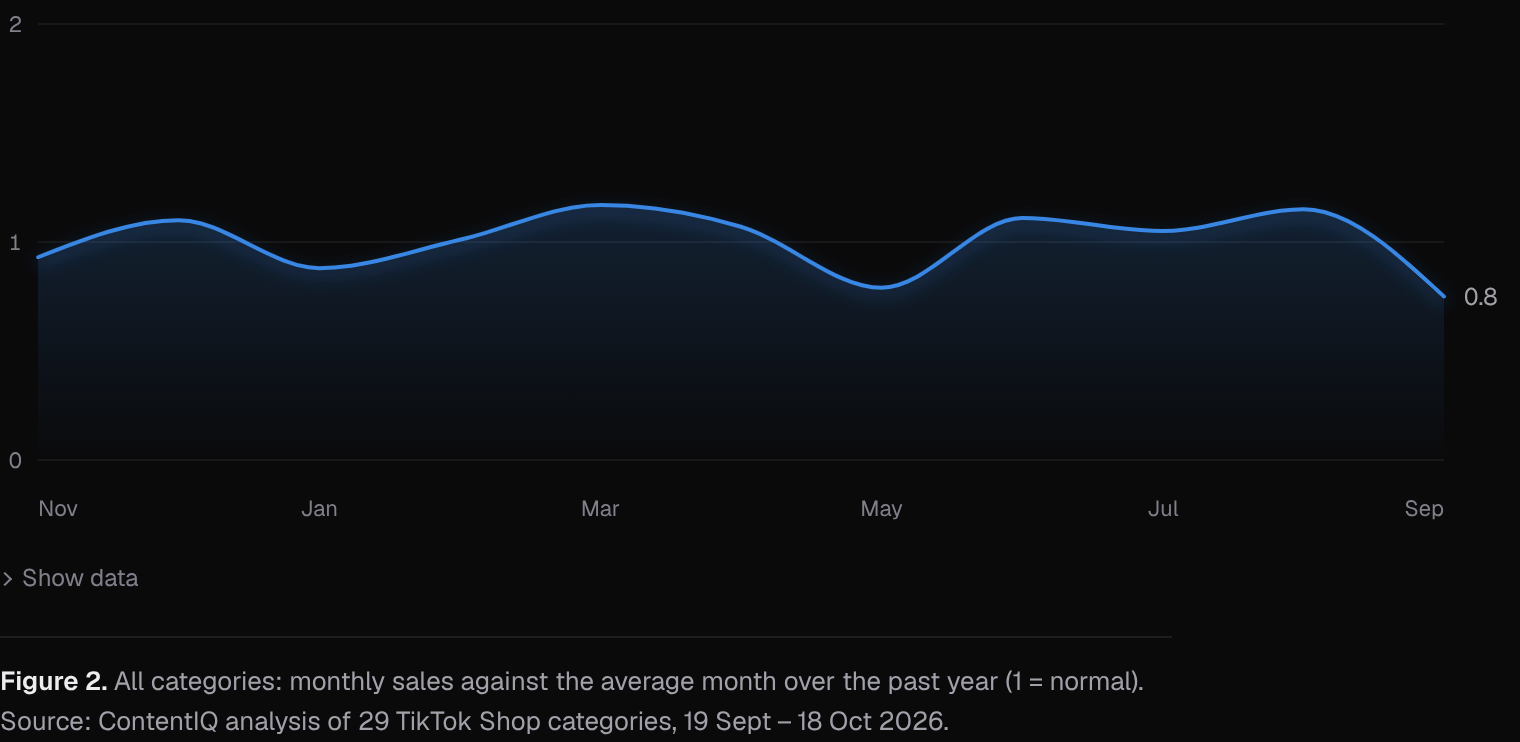
Across all categories, November 2025 was 0.93× a normal month and December 2025 was 1.10×. Combining them into a single Black Friday window therefore hides a difference: in this one year, the market was below normal in November and above it in December.
Other months moved as much. March 2026 was 1.17× and August 2026 was 1.15×, while May 2026 was 0.79× and September 2026 was 0.75×. A year-end peak is not the largest swing in this series, and the series has one observation per calendar month, so one-off events and trend cannot be ruled out as drivers.
Halloween offers a rehearsal for the current window. Last year, only Muslim Fashion (1.01×) and Collectibles (1.00×) reached normal in its months. Toys & Hobbies (0.66×), Furniture (0.65×), Kids' Fashion (0.65×) and Household Appliances (0.61×) were well below.
6. Results: current revenue share and momentum
Beauty & Personal Care held 19.2% of revenue in the last 4 weeks (about $263 million), followed by Womenswear & Underwear (13.2%), Sports & Outdoor (6.9%) and Health (6.6%).
Most categories were softer than the prior period. Only Home Supplies (+1.1%) and Baby & Maternity (+0.1%) grew over the last 4 weeks against the previous 4; the other 23 of the 25 categories in the table fell, from -2.7% (Kitchenware) to -18.8% (Furniture). Over 13 weeks, Collectibles (+7.1%), Jewelry Accessories & Derivatives (+6.0%) and Books, Magazines & Audio (+3.0%) were the stronger ones; Household Appliances fell 17.1%.
Seasonal strength and momentum point in different directions for some categories. Menswear & Underwear (1.11× last year) is down 9.5% over 4 weeks and 10.6% over 13. Furniture (1.05×) is down 18.8% over 4 weeks, and Sports & Outdoor (1.07×) is down 8.1%. Some of this may reflect the usual pre-peak pattern, but a single year cannot tell us.
| Category | Share of revenue | Last 4 weeks vs 4 before | Last 13 weeks vs 13 before | Revenue, last 4 weeks |
|---|---|---|---|---|
| Beauty & Personal Care | 19.2% | -4.2% | -2.9% | $263.2M |
| Womenswear & Underwear | 13.2% | -4.7% | -5% | $180M |
| Sports & Outdoor | 6.9% | -8.1% | -9.9% | $94.2M |
| Health | 6.6% | -4% | -0.6% | $90.6M |
| Fashion Accessories | 5.6% | -11.4% | +1.3% | $77.1M |
| Home Supplies | 5% | +1.1% | -2.2% | $67.7M |
| Phones & Electronics | 4.7% | -10.8% | -6.9% | $63.9M |
| Collectibles | 3.6% | -5% | +7.1% | $49.8M |
| Menswear & Underwear | 3.3% | -9.5% | -10.6% | $45.3M |
| Household Appliances | 3.1% | -8.9% | -17.1% | $41.7M |
| Furniture | 2.9% | -18.8% | -8.8% | $40.3M |
| Automotive & Motorcycle | 2.7% | -7.1% | -6.4% | $37.6M |
| Shoes | 2.7% | -12.5% | -7.7% | $37.2M |
| Toys & Hobbies | 2.5% | -9.1% | +1.6% | $34.5M |
| Home Improvement | 2.3% | -6.3% | -6.7% | $31.7M |
Note. Revenue is estimated weekly category revenue; shares are of the categories shown in our data.
7. Discussion
For brands, the evidence supports a cautious reading. Categories that sold above a normal month last year, such as Pre-Owned, Menswear & Underwear and Kids' Fashion, are candidates for a Black Friday test. Categories that sold below it, such as Toys & Hobbies and Household Appliances, may need a different reason to be promoted, such as clearance or gifting. Those lifts may reflect the broader holiday season, price promotions or category mix, and we cannot attribute them to any tactic. Observational data also makes returns to promotion hard to isolate [2].
Recommendation, not a finding: a proposed test plan before the peak. (1) Pick one to three products or content angles in categories with last year's index above 1 and check that the latest 4- and 13-week momentum is not sharply negative. (2) Set the metric, budget cap and stop rule before launch. (3) Run a small baseline in the weeks before the window and compare it with the same products during it. (4) Keep a comparison group, such as a product or creator batch not given extra budget, to separate promotion from season. (5) Check stock and fulfilment for the strongest categories. (6) Confirm this year's campaign dates and rules with the platform directly, since this paper does not supply them. (7) After the window, record results by week and treat them as one more year of data.
Alternative explanations include a single year's one-off events, price cuts that raise volume but not margin, shifts in the mix of top-selling products, and the revenue estimates themselves. The seasonal indices are not forecasts, and recent declines may be temporary.
8. What this means for brands and founders
- Test by category, not by calendar: in last year's Black Friday months Pre-Owned sold at 1.23× a normal month and Toys & Hobbies at 0.81×, so check your own category's index before sizing a campaign.
- Do not treat November and December as one block: the market was 0.93× a normal month in November 2025 and 1.10× in December 2025, so compare weekly results rather than assuming a flat peak.
- Check momentum against seasonality: Menswear & Underwear sold at 1.11× last year but revenue is down 9.5% over the last 4 weeks, so start with a small pilot and a pre-set stop rule.
- Use Halloween as a rehearsal if you sell in a category that ran well below normal then, such as Toys & Hobbies (0.66×) or Household Appliances (0.61×), and reconsider the Black Friday angle.
9. Conclusion
Last year's pattern in our data points to uneven opportunity: Pre-Owned (1.23×), Menswear & Underwear (1.11×) and Kids' Fashion (1.10×) sold above a normal month in Black Friday and holiday months, while Toys & Hobbies (0.81×) sold below. Market-wide, November 2025 (0.93×) and December 2025 (1.10×) differed, and the latest 4 weeks show most categories softer than the prior 4.
These are descriptive, single-year observations of US TikTok Shop. They suit a hypothesis-led, small-scale test calendar, not a forecast or a promise of results.
Methodology
Weekly category figures for the US (estimated revenue, its split between video, LIVE and the shop tab, affiliate revenue, shops and active products, and a year of weekly revenue) and daily rankings of each category’s top-selling products (unit price, commission rate, launch date and revenue by channel) were collected from several independent sources. Medians of price and commission are weighted by revenue; momentum compares the latest weeks with the same number of weeks before. This paper covers 2026-09-19 to 2026-10-18.
Limitations
Product figures cover the top-selling products we track in each category, not every listing, so they describe what sells best rather than everything on sale. Results are associations, not causes. Paid promotion, creator audience size and product price are not fully controlled for. Revenue, views and sales are estimates, not figures reported by TikTok. No in-depth video analysis is used in this paper, so it says nothing about video content, creators or products. The monthly series covers one year, so season cannot be separated from one-off events or trend. Black Friday / Cyber Monday and Holiday gifting map to the same calendar months and show identical values. The sample lists 29 categories, the evidence reports 28, and the momentum table shows 25, so some categories are not covered in every statistic. Only the top 10 categories above normal and those below normal are listed per moment. The evidence gives no confidence ranges for the indices or growth rates. Revenue values are estimates. Data are US TikTok Shop only. We do not state this year's campaign dates or platform rules.
References
- [1]Cleveland, R. B., Cleveland, W. S., McRae, J. E., & Terpenning, I. (1990). STL: A seasonal-trend decomposition procedure based on loess. Journal of Official Statistics, 6(1), 3–73.
- [2]Lewis, R. A., & Rao, J. M. (2015). The unfavorable economics of measuring the returns to advertising. The Quarterly Journal of Economics, 130(4), 1941–1973.
Cite as
MediaLabs Research, in collaboration with Coherence Limited (2026). TikTok Shop Black Friday planning: category seasonality. ContentIQ Working Paper CIQ-WP-2026-71, version 1. https://medialabs-co.com/research/tiktok-shop-black-friday-planning
Analysis and data: Coherence Research, Coherence ContentIQ. Published by MediaLabs in collaboration with Coherence Limited.
Version history
- Version 118 Oct 2026This version