ContentIQ working paperCIQ-WP-2026-10TikTok ShopVersion 11 Oct 2026
Top-selling products on TikTok Shop cluster between $20 and $100, but each category has its own price band
2,800 top-selling products across 29 categories, 2 Sept–1 Oct 2026
MediaLabs Research · in collaboration with Coherence Limited
Key findings
- 01$39revenue-weighted median price of top-selling products
- 02$24–$88price range holding the middle half of revenue
- 0362.8%share of top-product revenue in the $20–100 bands
- 041.14×revenue per product in the $20–35 band, against the average product
- 050.66×revenue per product for products under $10
- 06$23 to $160spread of category median prices, from Jewelry Accessories & Derivatives to Collectibles
Contents
Abstract
We analysed unit prices of the top-selling products tracked on TikTok Shop to see which price bands carry revenue. The revenue-weighted median price is $39, and the middle half of revenue sits between $24 and $88. The three bands from $20 to $100 account for 62.8% of top-product revenue, and products in the $20–35 band earn 1.14× the average product. Category medians range from $23 to $160, so a single price rule does not hold across the marketplace.
1. Introduction
Price is one of the first decisions a brand makes on TikTok Shop, and one of the first things a creator weighs when choosing what to feature. The practical question is where sales actually concentrate: do cheap impulse items dominate, or do higher-priced products carry more of the revenue? And does the answer depend on the category?
Prior work suggests that price presentation matters at the margin. Field experiments found that prices just below round numbers, such as $9 endings, can raise retail sales [1]. Research on online retail also shows that sales extend well beyond the bestsellers into a long tail of niche products [2], which is a reminder that a study of top sellers describes only the head of the market. Live-stream selling has been linked to trust and engagement in social commerce [3], which may matter more for higher-priced purchases, although we do not test that here.
This paper describes the price bands where top-selling products on TikTok Shop sit, how much revenue each band carries, and how typical prices differ across categories.
2. Data
The sample is 2,800 top-selling products. They are the products on which the marketplace figures rest, and they are tracked across 29 categories. The window runs from 2 September to 1 October 2026, and prices are taken from the latest week of that window (as of 1 October 2026).
For each product we recorded its unit price and its revenue. Products are grouped into six price bands: under $10, $10–20, $20–35, $35–60, $60–100 and $100 and over. The category table in this paper shows 25 categories, with 100 products each. This paper does not draw on video analysis, so no video counts are reported.
Weekly category figures for the US (estimated revenue, its split between video, LIVE and the shop tab, affiliate revenue, shops and active products, and a year of weekly revenue) and daily rankings of each category’s top-selling products (unit price, commission rate, launch date and revenue by channel) were collected from several independent sources. Medians of price and commission are weighted by revenue; momentum compares the latest weeks with the same number of weeks before. This paper covers 2026-09-02 to 2026-10-01: 2,800 top-selling products across 29 categories.
3. Methods
Prices are the unit prices of the top-selling products tracked in each category in the latest week. Medians and ranges are weighted by revenue, so a product that sells more counts for more. The overall middle half is the price range that holds the central half of revenue-weighted products, and the low and high values for each category are the lower and upper ends of its revenue-weighted range.
For each price band we computed the number of products, the share of total top-product revenue, and revenue per product relative to the average product, where 1 is the average across all 2,800 products. A value above 1 means products in that band earn more than the average top-selling product. No confidence intervals were computed for these figures, so differences of a few hundredths should not be read as meaningful.
4. Results: where revenue sits across price bands
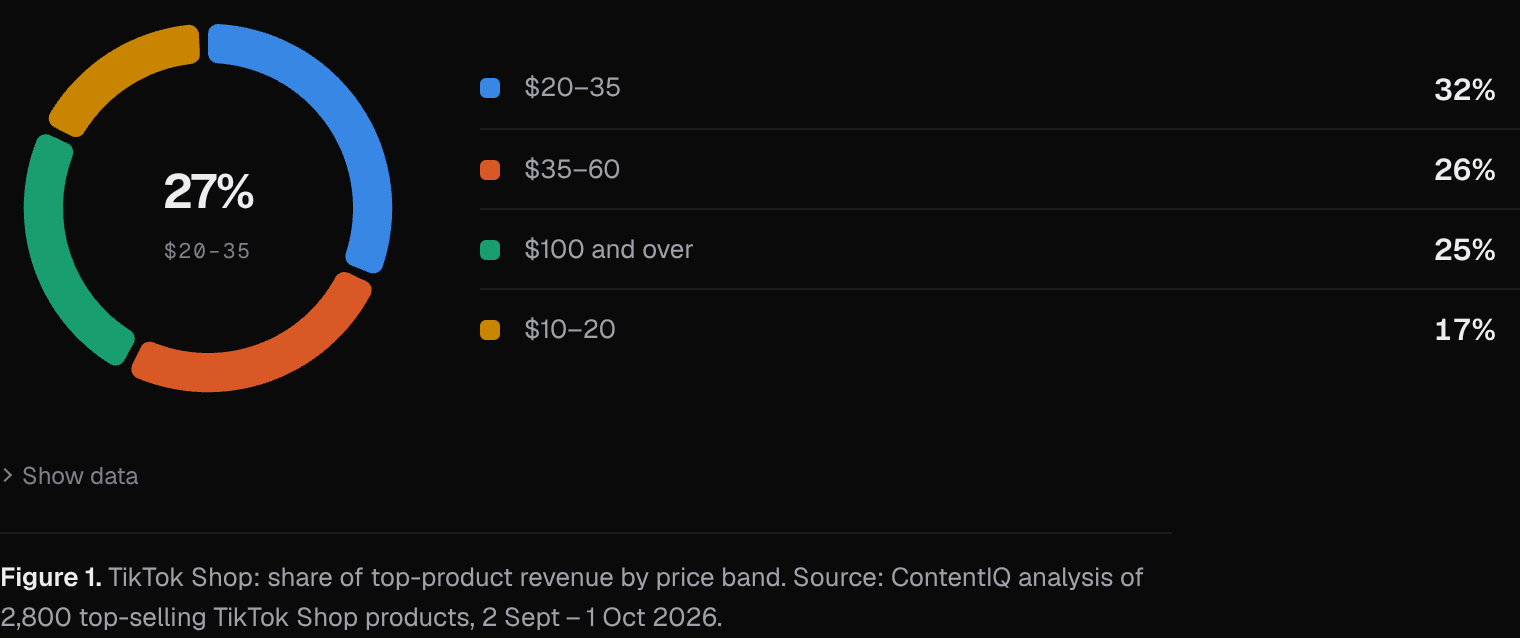
The revenue-weighted median price of top-selling products is $39, and the middle half of revenue sits between $24 and $88. The $20–35 band is the largest, with 657 products and 26.8% of revenue. The $35–60 band follows with 554 products and 21.8%, then $100 and over with 631 products and 20.6%.
Together the three bands from $20 to $100 hold 62.8% of revenue. Products under $20 are common in the sample but carry little revenue: $10–20 has 492 products and 14.2% of revenue, and under $10 has 100 products and 2.4%. The $60–100 band also takes 14.2% with 366 products.
The picture is a broad middle with a second, smaller concentration at $100 and over, rather than a market driven by the cheapest items.
5. Results: revenue per product by band
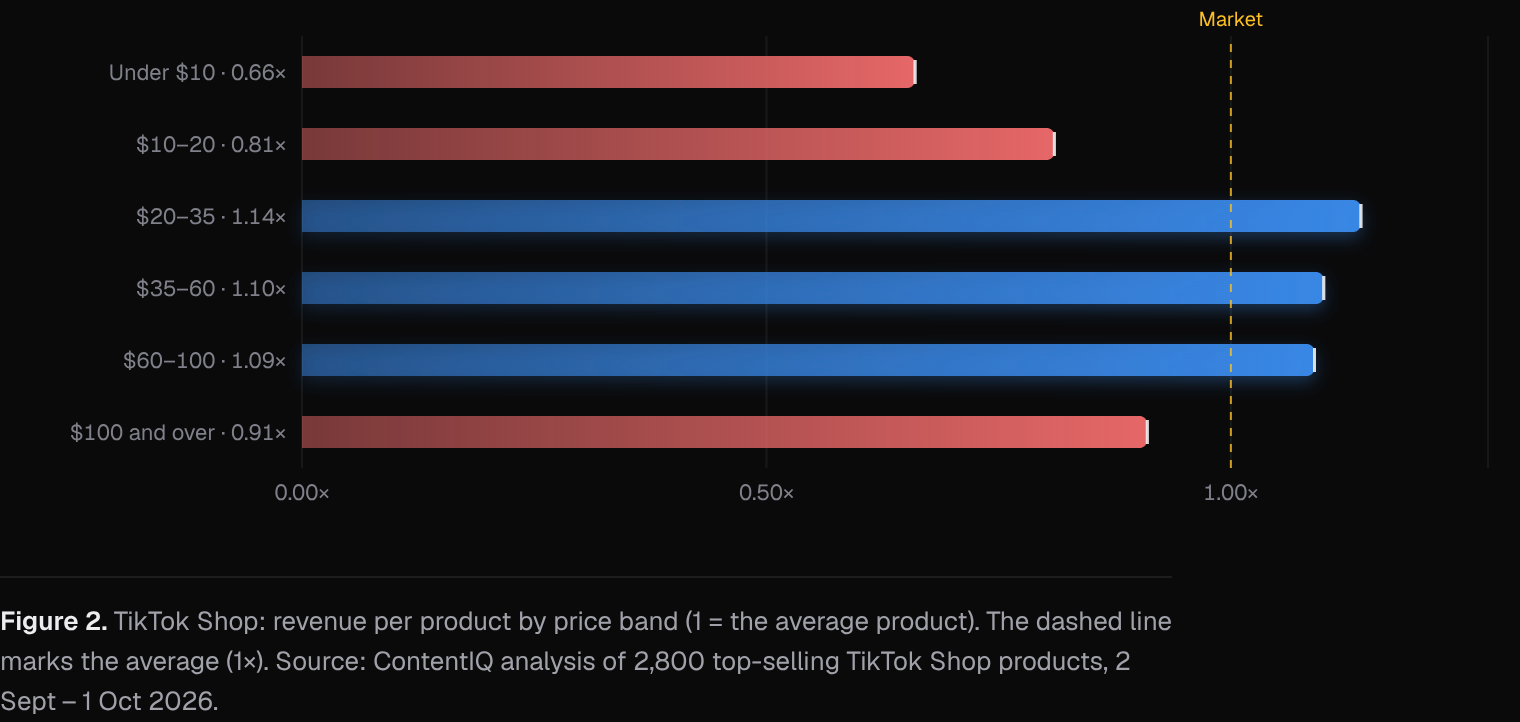
Share of revenue partly reflects how many products fall in a band, so we also compared revenue per product. Products in the $20–35 band earn 1.14× the average product, those in $35–60 earn 1.10× and those in $60–100 earn 1.09×. The three bands are close to one another.
Below $20 the figure drops: 0.81× for $10–20 and 0.66× for under $10. Products at $100 and over earn 0.91×, so the high-price tail has many products but each earns slightly less than average. This pattern is consistent with the middle bands being the most productive for a top-selling listing, but the evidence describes products that already sell and does not show that moving a product into a band would raise its revenue.
6. Results: prices differ widely by category
Category medians range from $23 for Jewelry Accessories & Derivatives, $24 for Toys & Hobbies and about $25 for Home Supplies and for Books, Magazines & Audio, up to $145 for Furniture, $150 for Household Appliances and $160 for Collectibles. Beauty & Personal Care ($28), Health ($29), Food & Beverages ($29.99) and Menswear & Underwear ($31) sit in the lower band.
Spreads also vary. Shoes are tightly grouped, with a range of $39 to $69 around a $49 median. Home Improvement runs from $27 to $449 around a median of $85, and Collectibles from about $91 to $349.99. Jewelry Accessories & Derivatives has a $23 median but a high end of $155, which shows that a low median can coexist with a long upper tail.
| Category | Products (n) | Median price | Middle half of revenue |
|---|---|---|---|
| Beauty & Personal Care | 100 | $28.00 | $20–43 |
| Womenswear & Underwear | 100 | $35.00 | $26–43 |
| Sports & Outdoor | 100 | $38.00 | $27–99 |
| Health | 100 | $29.00 | $19–39 |
| Household Appliances | 100 | $150.00 | $79–206 |
| Phones & Electronics | 100 | $65.00 | $35–179 |
| Shoes | 100 | $49.00 | $39–69 |
| Textiles & Soft Furnishings | 100 | $59.00 | $34–95 |
| Furniture | 100 | $145.00 | $49–266 |
| Home Supplies | 100 | $25.00 | $16–37 |
| Menswear & Underwear | 100 | $31.00 | $25–49 |
| Home Improvement | 100 | $85.00 | $27–449 |
| Fashion Accessories | 100 | $68.00 | $40–92 |
| Tools & Hardware | 100 | $69.00 | $28–129 |
| Automotive & Motorcycle | 100 | $32.00 | $15–66 |
Note. Medians and ranges are weighted by revenue: half of the category’s top-product revenue comes from products priced below the median.
7. Discussion
For brands, the evidence points to the $20–100 range as where most top-selling revenue sits, with the $20–35 band showing the highest revenue per product. The category medians matter more than the overall median, however. A $39 price would sit above the typical top seller in Home Supplies and below the typical top seller in Household Appliances, so benchmarks should be taken within a category. For creators, the same logic applies: the typical product in a category sets the price level an audience is used to seeing.
Several alternative explanations apply. Revenue is the product of price and volume, so a band may lead because of demand and not because of the price itself. Price bands also correlate with category mix, and the large share of $20–100 revenue may reflect which categories have many top sellers. Promotions and discounts may change the unit price observed in the latest week. Live selling may support higher-priced purchases through trust [3], and round-number price points may affect sales [1], but neither is measured here.
8. Conclusion
Top-selling products on TikTok Shop cluster around a $39 revenue-weighted median, with the middle half of revenue between $24 and $88. The $20–100 bands carry 62.8% of revenue, and revenue per product peaks in the $20–35 band at 1.14× the average. Products under $10 earn 0.66× the average.
Category price levels differ far more than the overall figure suggests, from a $23 median to a $160 median, so brands should set expectations by category. These are associations among products that already sell, and they should be read as a map of where sales concentrate, not as a guide to what a price change would do.
Methodology
Weekly category figures for the US (estimated revenue, its split between video, LIVE and the shop tab, affiliate revenue, shops and active products, and a year of weekly revenue) and daily rankings of each category’s top-selling products (unit price, commission rate, launch date and revenue by channel) were collected from several independent sources. Medians of price and commission are weighted by revenue; momentum compares the latest weeks with the same number of weeks before. This paper covers 2026-09-02 to 2026-10-01: 2,800 top-selling products across 29 categories.
Limitations
Product figures cover the top-selling products we track in each category, not every listing, so they describe what sells best rather than everything on sale. Results are associations, not causes. Paid promotion, creator audience size and product price are not fully controlled for. Revenue, views and sales are estimates, not figures reported by TikTok. The analysis covers top-selling products only, so it says nothing about products that do not sell or about the long tail beyond the top sellers. Prices come from the latest week of a one-month window and may reflect temporary promotions. No ranges or confidence intervals are available for the band shares or revenue-per-product ratios. The category table shows 25 categories, while the sample spans 29. Price bands overlap with category mix, and the study cannot separate the effect of price from that of category or demand.
References
- [1]Anderson, E. T., & Simester, D. I. (2003). Effects of $9 price endings on retail sales: Evidence from field experiments. Quantitative Marketing and Economics, 1(1), 93–110.
- [2]Brynjolfsson, E., Hu, Y. J., & Smith, M. D. (2003). Consumer surplus in the digital economy: Estimating the value of increased product variety at online booksellers. Management Science, 49(11), 1580–1596.
- [3]Wongkitrungrueng, A., & Assarut, N. (2020). The role of live streaming in building consumer trust and engagement with social commerce sellers. Journal of Business Research, 117, 543–556.
Cite as
MediaLabs Research, in collaboration with Coherence Limited (2026). Top-selling products on TikTok Shop cluster between $20 and $100, but each category has its own price band. ContentIQ Working Paper CIQ-WP-2026-10, version 1. https://medialabs-co.com/research/tiktok-shop-price-bands
Analysis and data: Coherence Research, Coherence ContentIQ. Published by MediaLabs in collaboration with Coherence Limited.
Version history
- Version 11 Oct 2026This version